It Invaded and It Was Merciless.
A Threnody for Time Displaced in the Wake of Chronic Migraines.
ROLES
RESEARCHER
DATA ANALYST
VISUAL DESIGNER
SOUND DESIGNER
RESEARCHER
DATA ANALYST
VISUAL DESIGNER
SOUND DESIGNER
TOOLS
TABLEAU
PHOTOSHOP
ILLUSTRATOR
ABELTON LIVE
TWOTONE
TABLEAU
PHOTOSHOP
ILLUSTRATOR
ABELTON LIVE
TWOTONE
AWARD
INFORMATION IS BEAUTIFUL: LONGLIST
INFORMATION IS BEAUTIFUL: LONGLIST
Can sound and visuals be used in tandem to accurately convey what chronic migraines feel like
to someone who has never had the experience?
What can a migraine look like?
Sound like?
Is there a common ground to be found via communicating with the sensory modalities that enable effective presentation of the subjective concepts of emotion, pain, and the perception of time?
After self-reflection and observation, will relating to others be more meaningful?
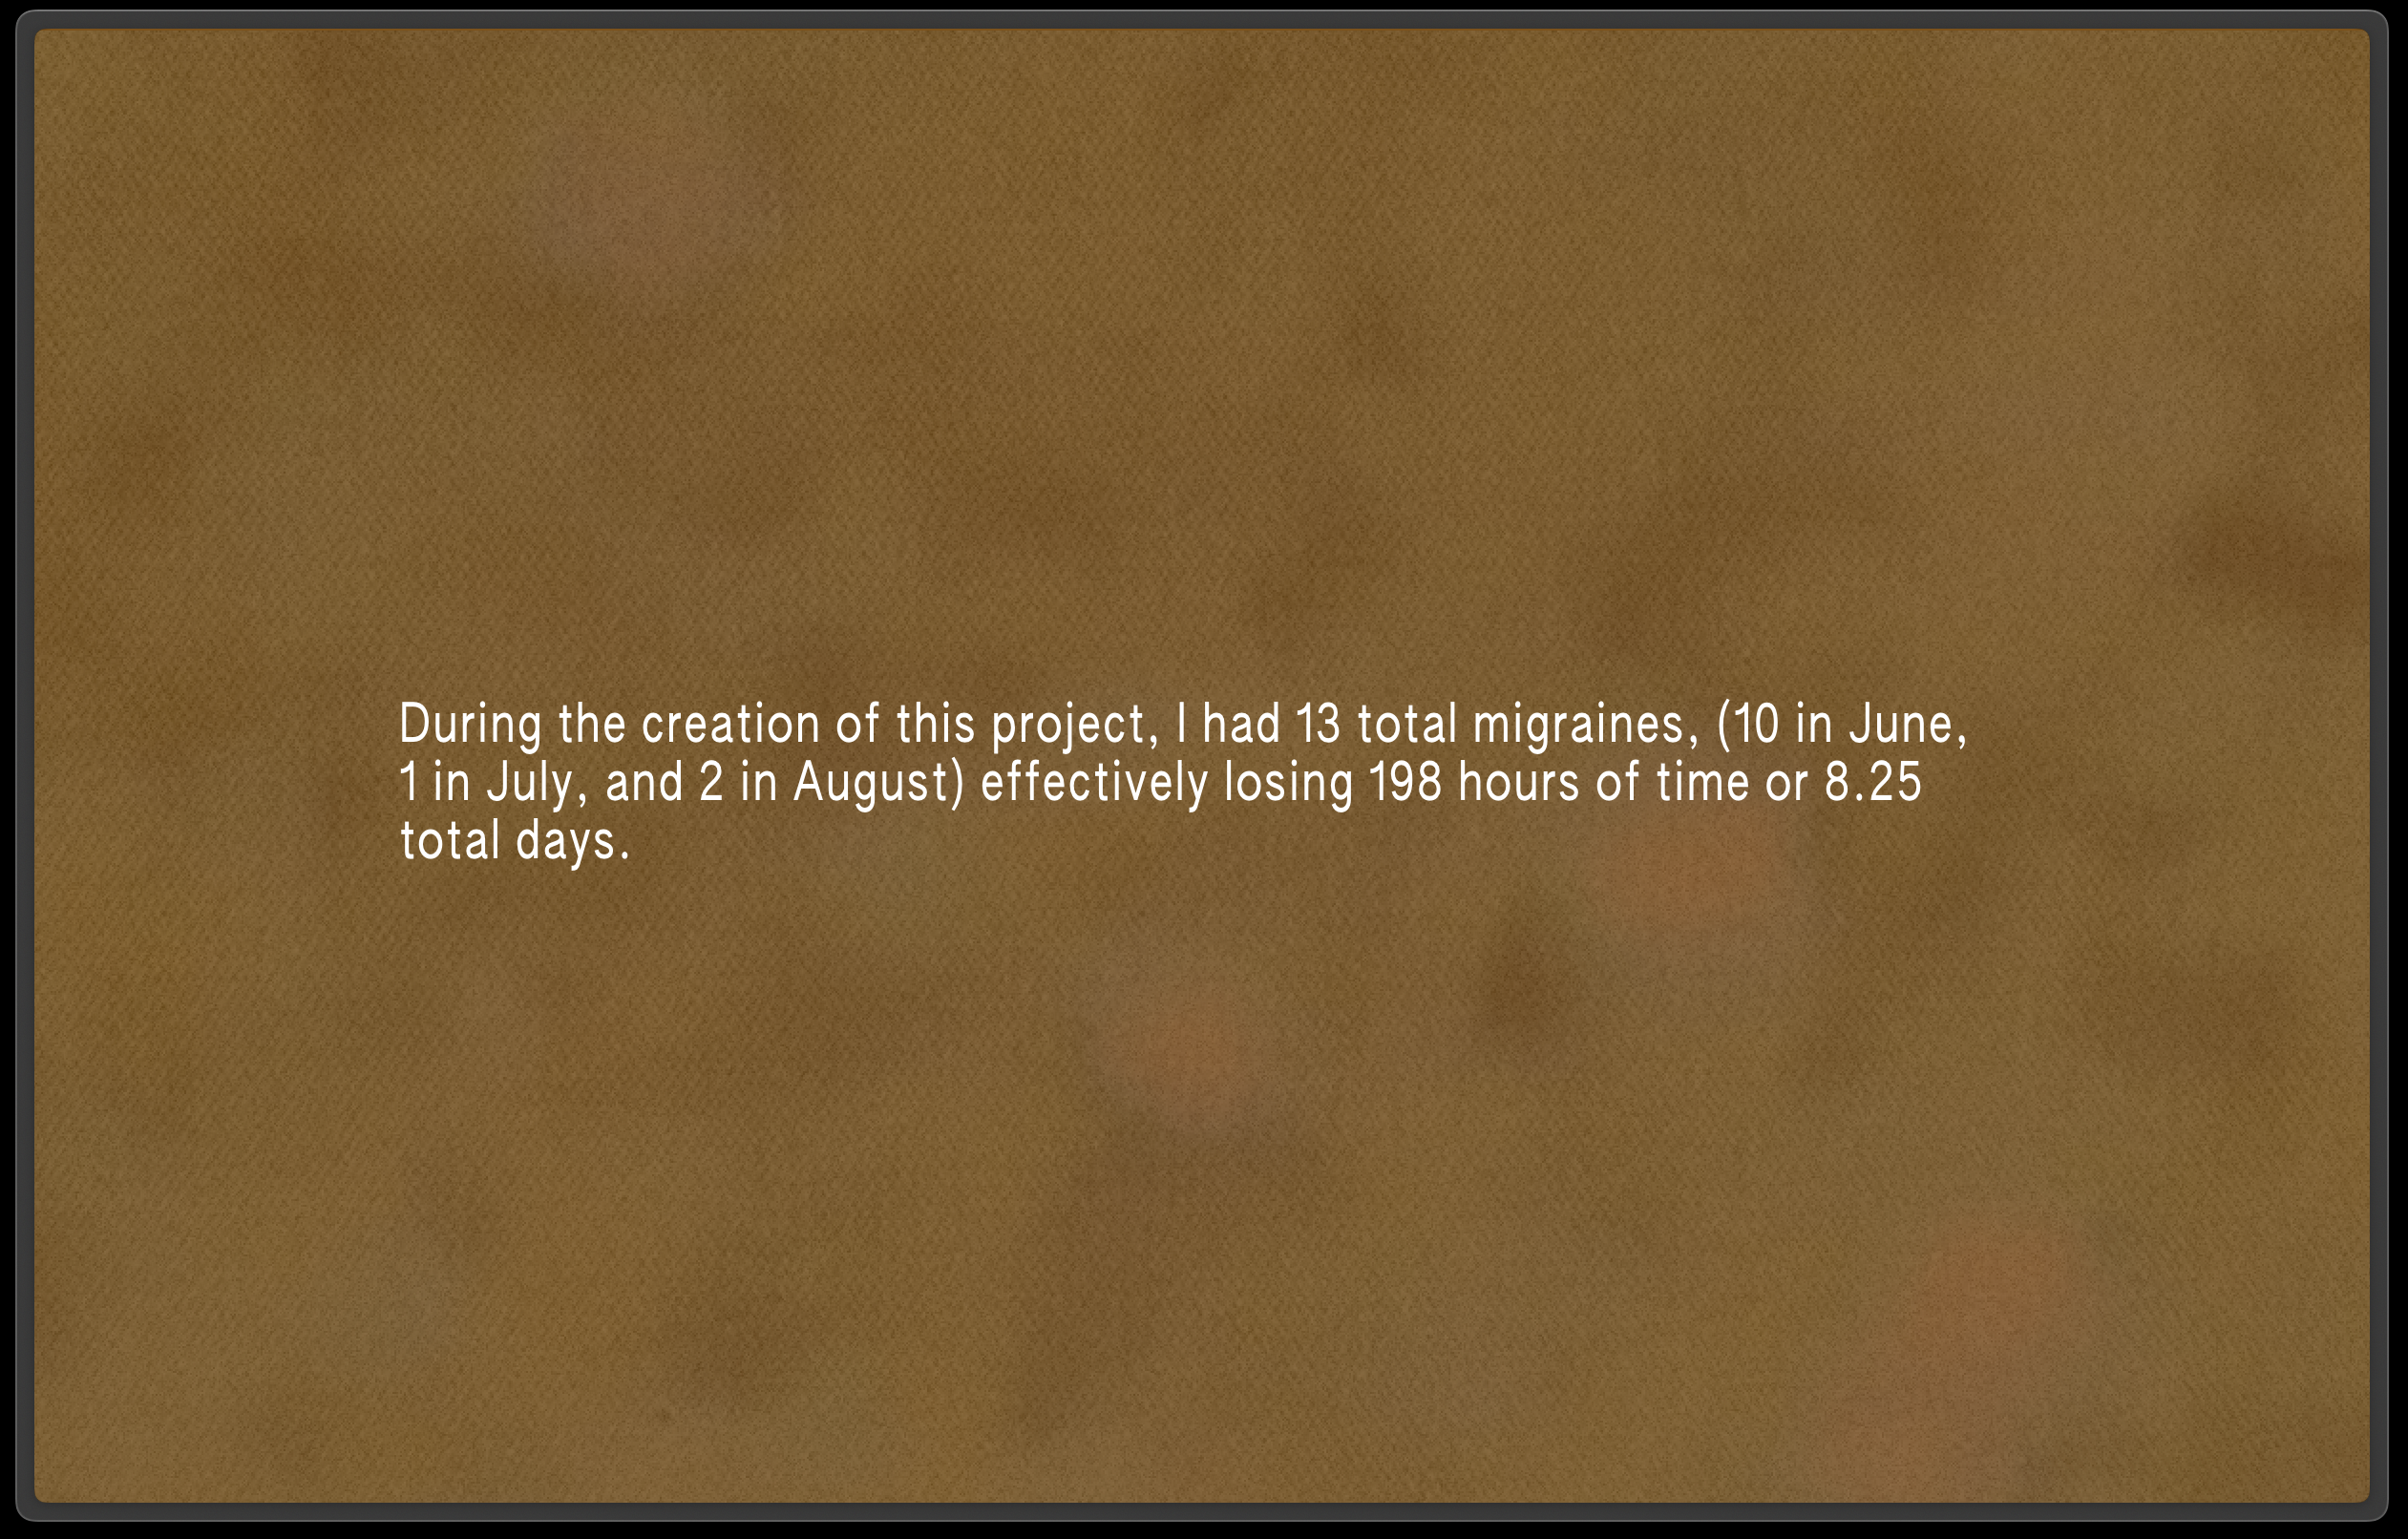
This project is not only an attempt to process and lament the hours I lost to chronic pain, but to reclaim autonomy over self, time, and the “Merciless Intruder” that has taken up residence in my body.
Initially living on the internet as an interactive webpage-as-mind where one could view and listen to my personal migraine data, I made the decision to archive this project in 2025 and present it in screenshot form below in order to mimick the provisory migraine experience.
What can a migraine look like?
Sound like?
Is there a common ground to be found via communicating with the sensory modalities that enable effective presentation of the subjective concepts of emotion, pain, and the perception of time?
After self-reflection and observation, will relating to others be more meaningful?
This project is not only an attempt to process and lament the hours I lost to chronic pain, but to reclaim autonomy over self, time, and the “Merciless Intruder” that has taken up residence in my body.
Initially living on the internet as an interactive webpage-as-mind where one could view and listen to my personal migraine data, I made the decision to archive this project in 2025 and present it in screenshot form below in order to mimick the provisory migraine experience.
Website
At the time of virtually presenting this project for my cohort and panel of judges, I had made the decision to diverge from traditional modes of presentation and draw from aspects of performance art with the goal of reproducing feelings of overstimulation that often come with the migraine experience. I recited the context and rationale behind this project’s creation while playing my data sonification at a medium-high volume. The sound and visual lags that often come unexpectedly with video calls aided in this effect.
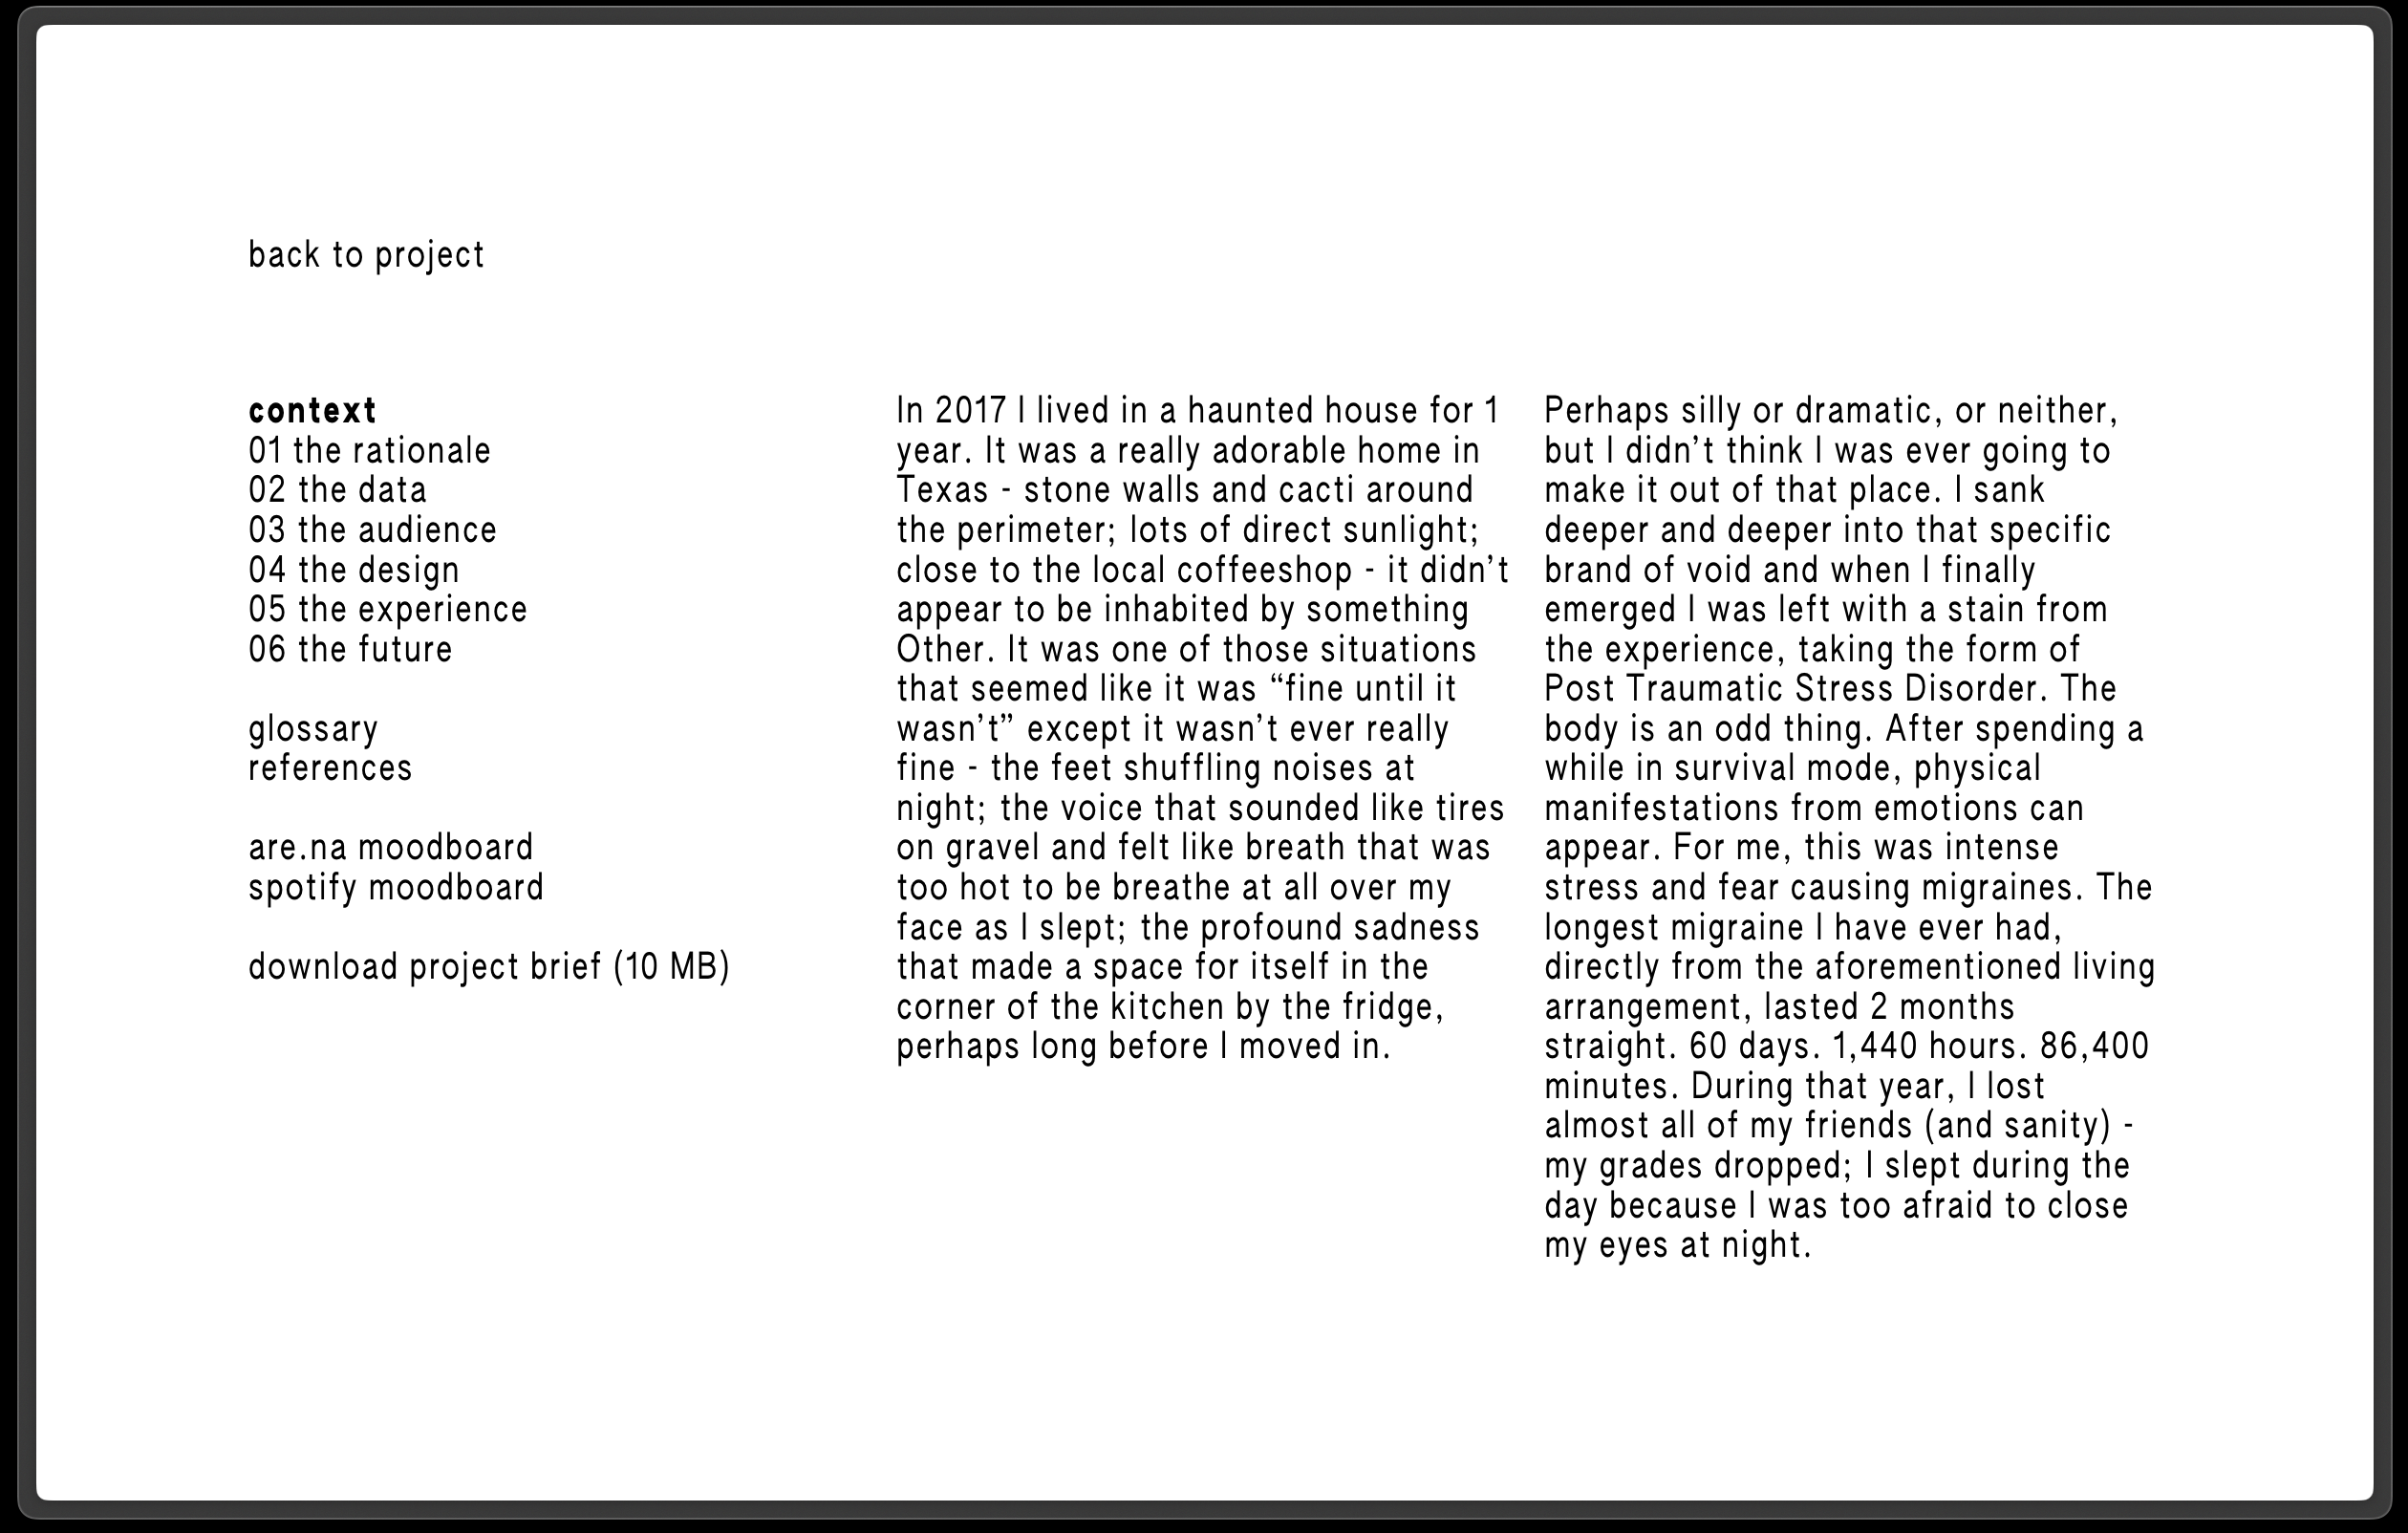
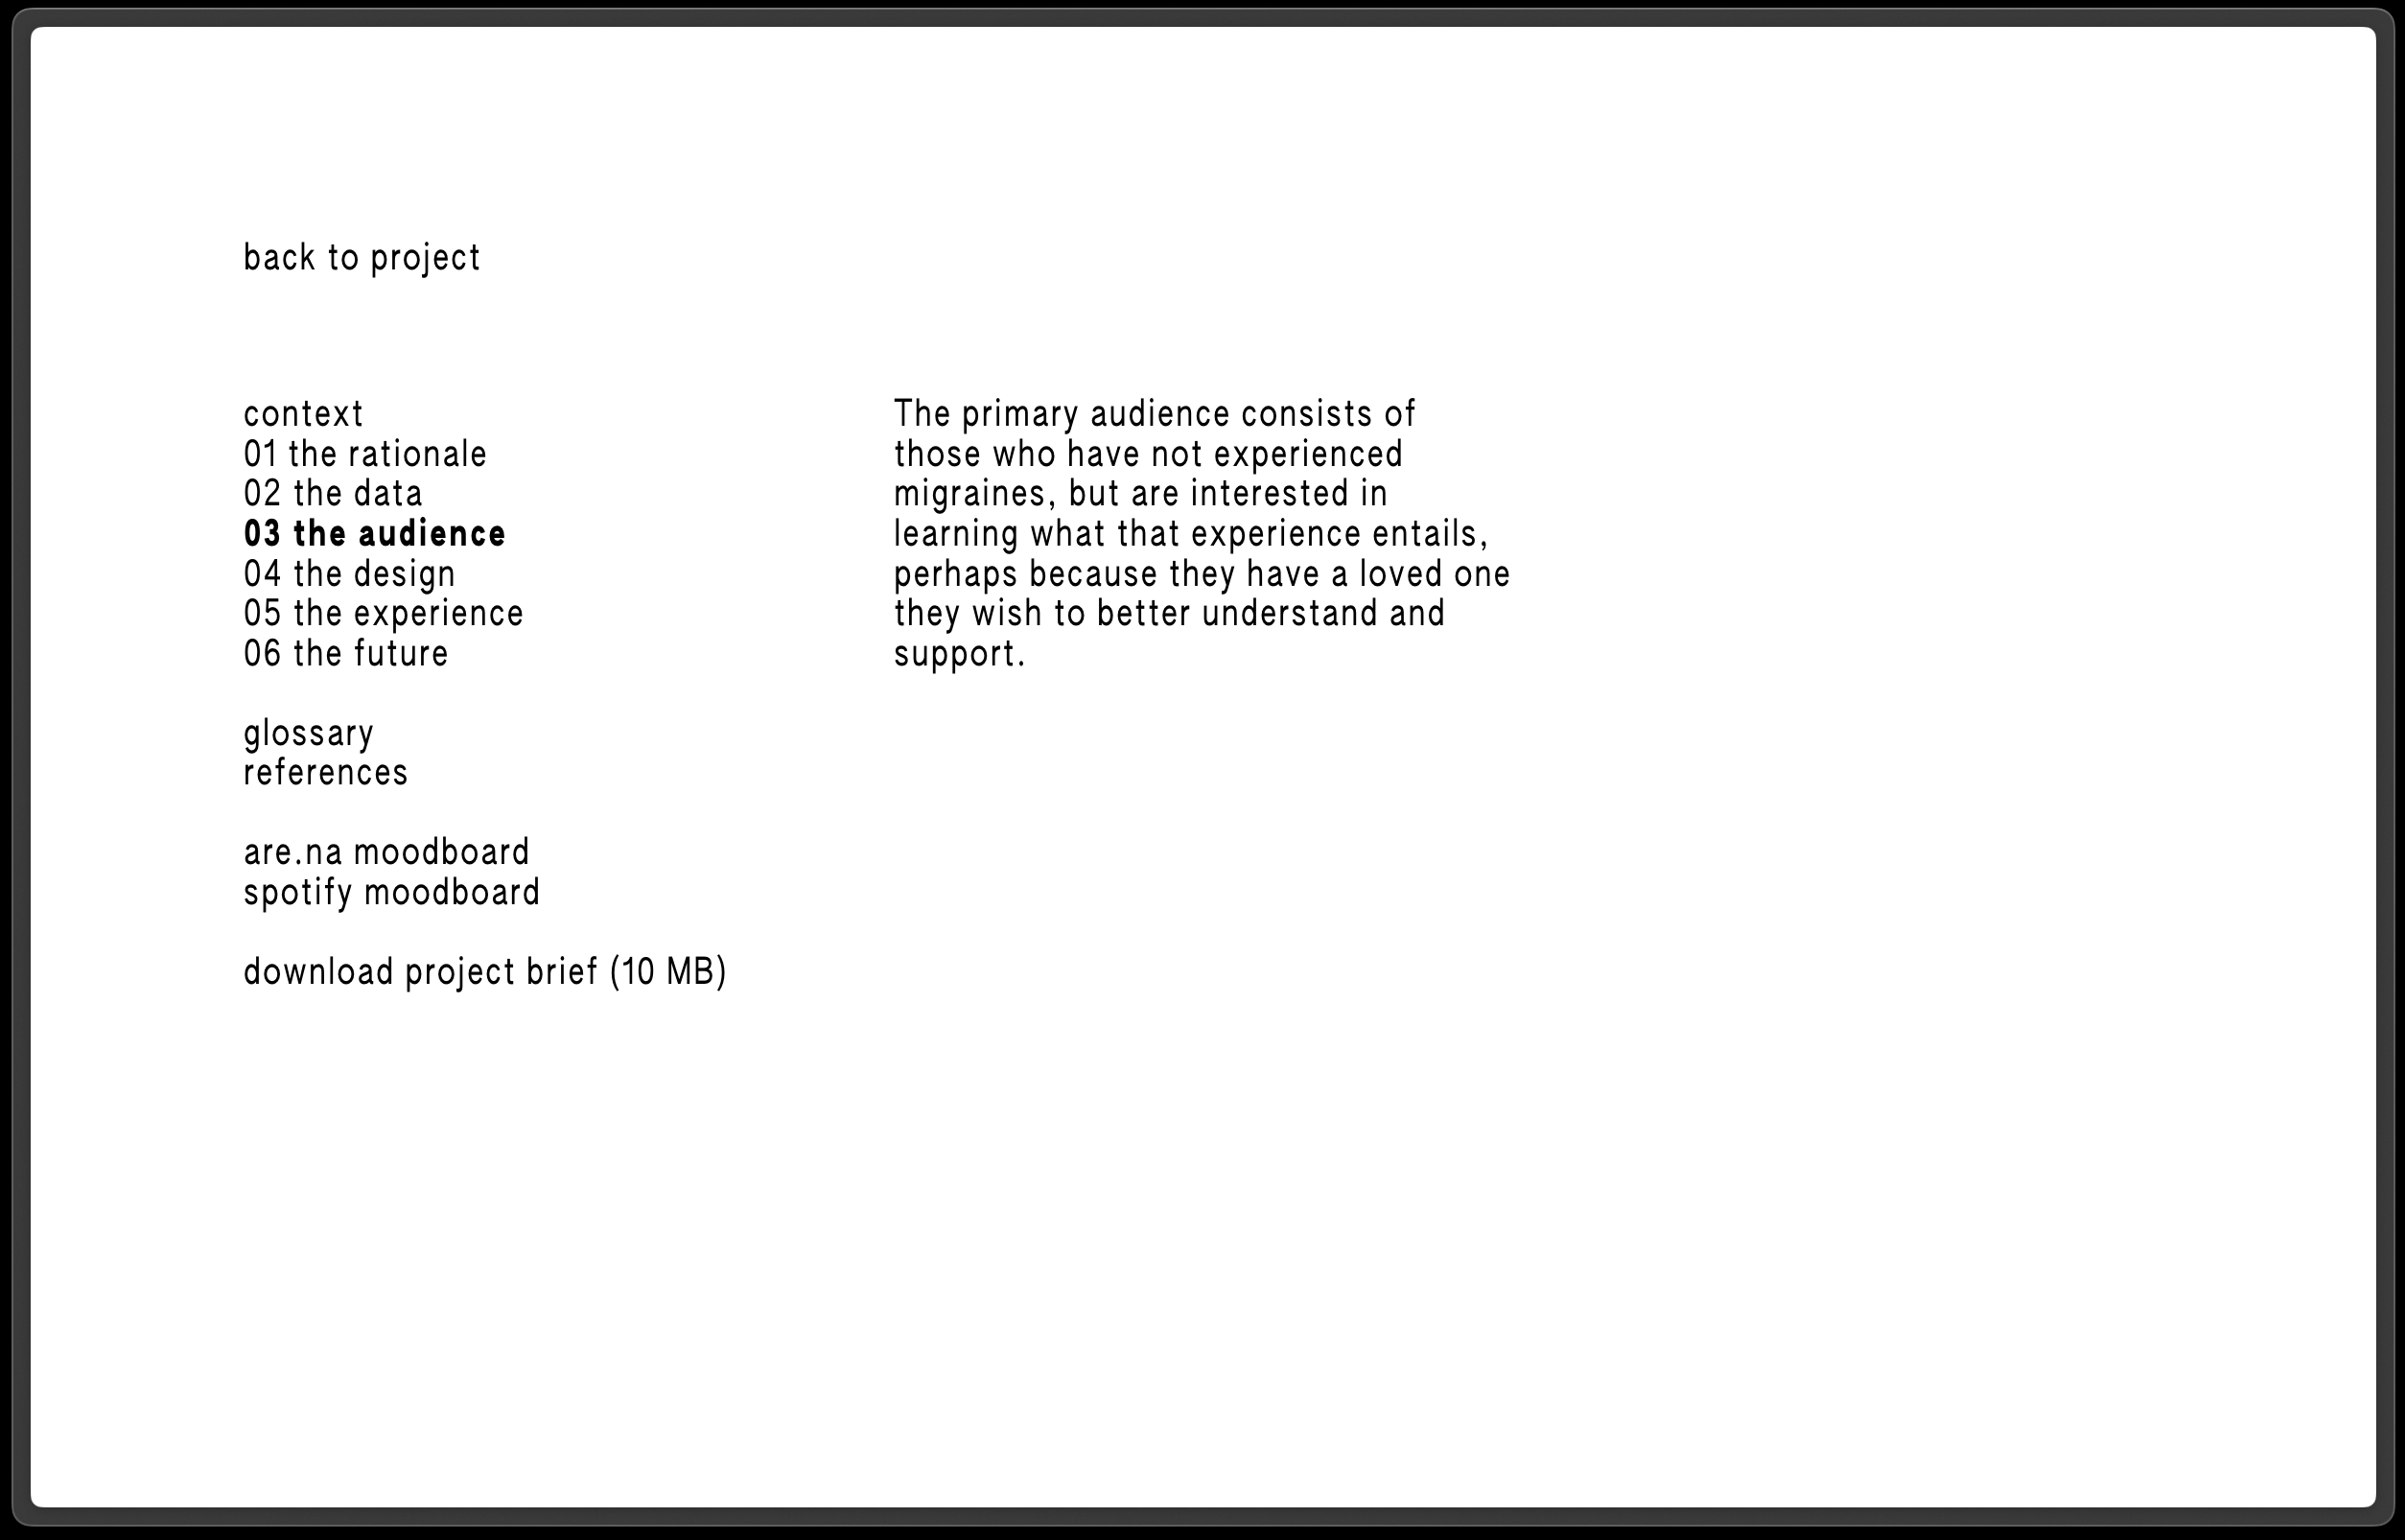
Upon navigating to the website, the viewer could choose whether or not to read the context behind the project, shown below, before proceeding.
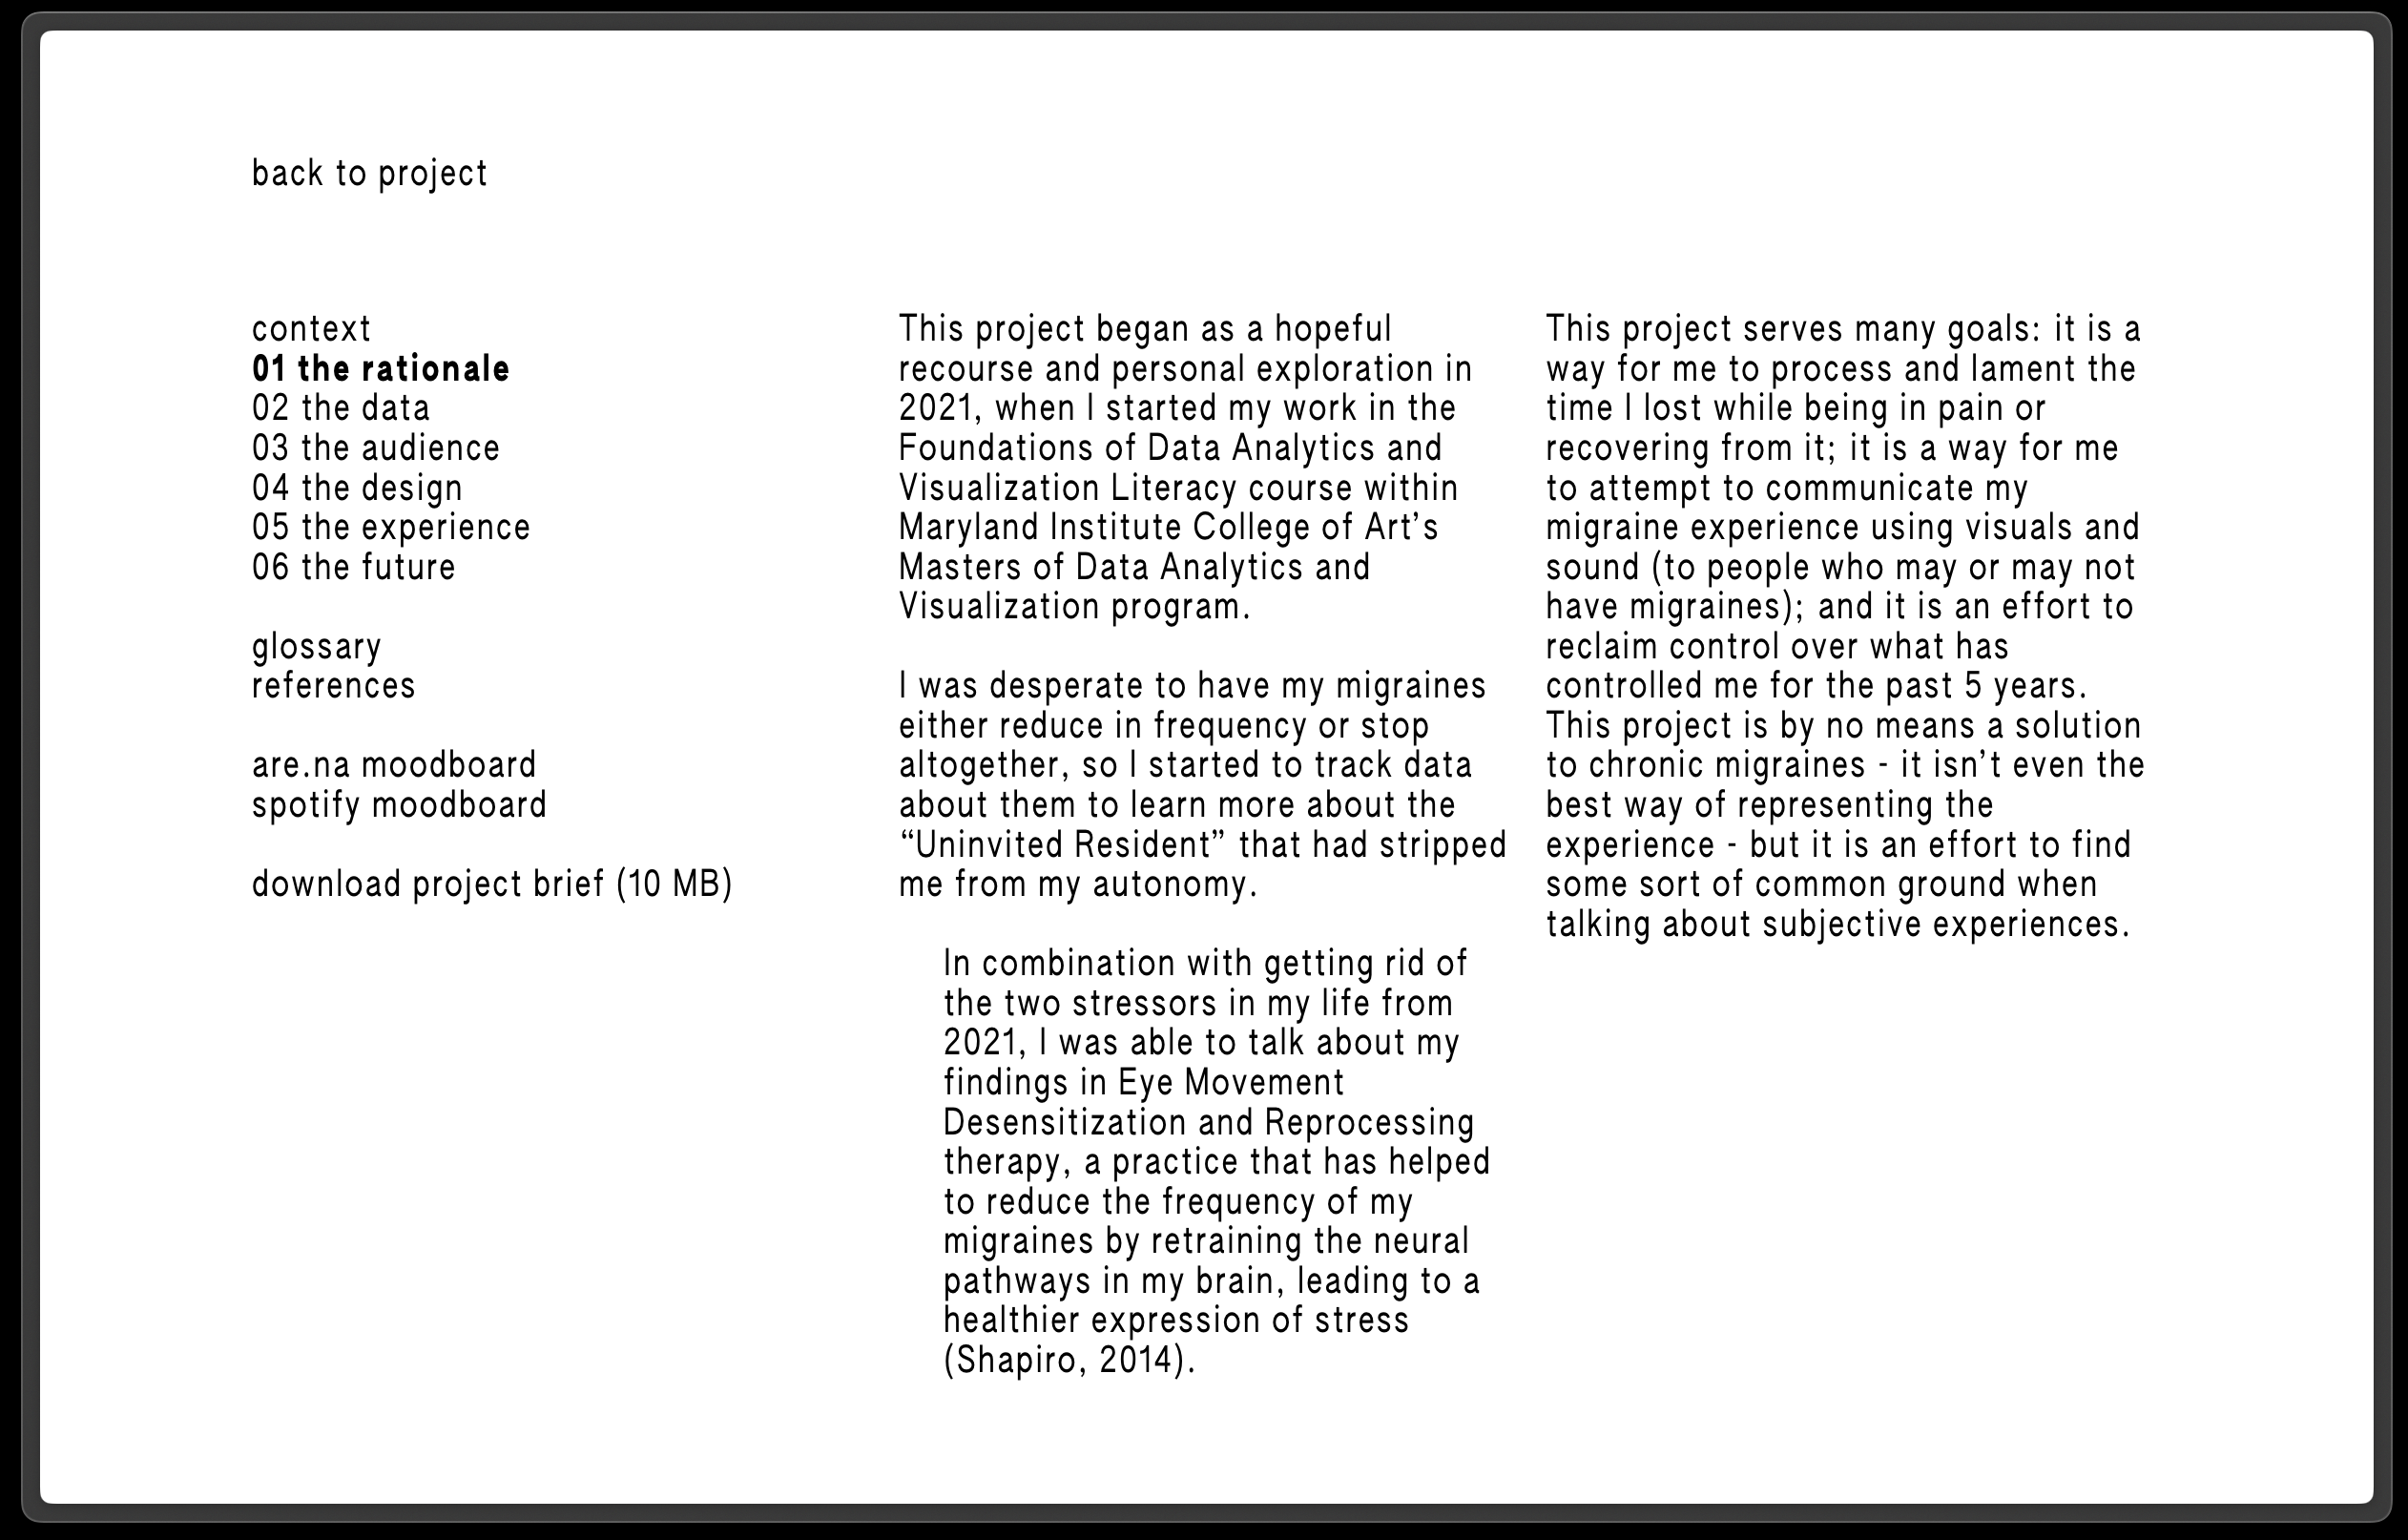
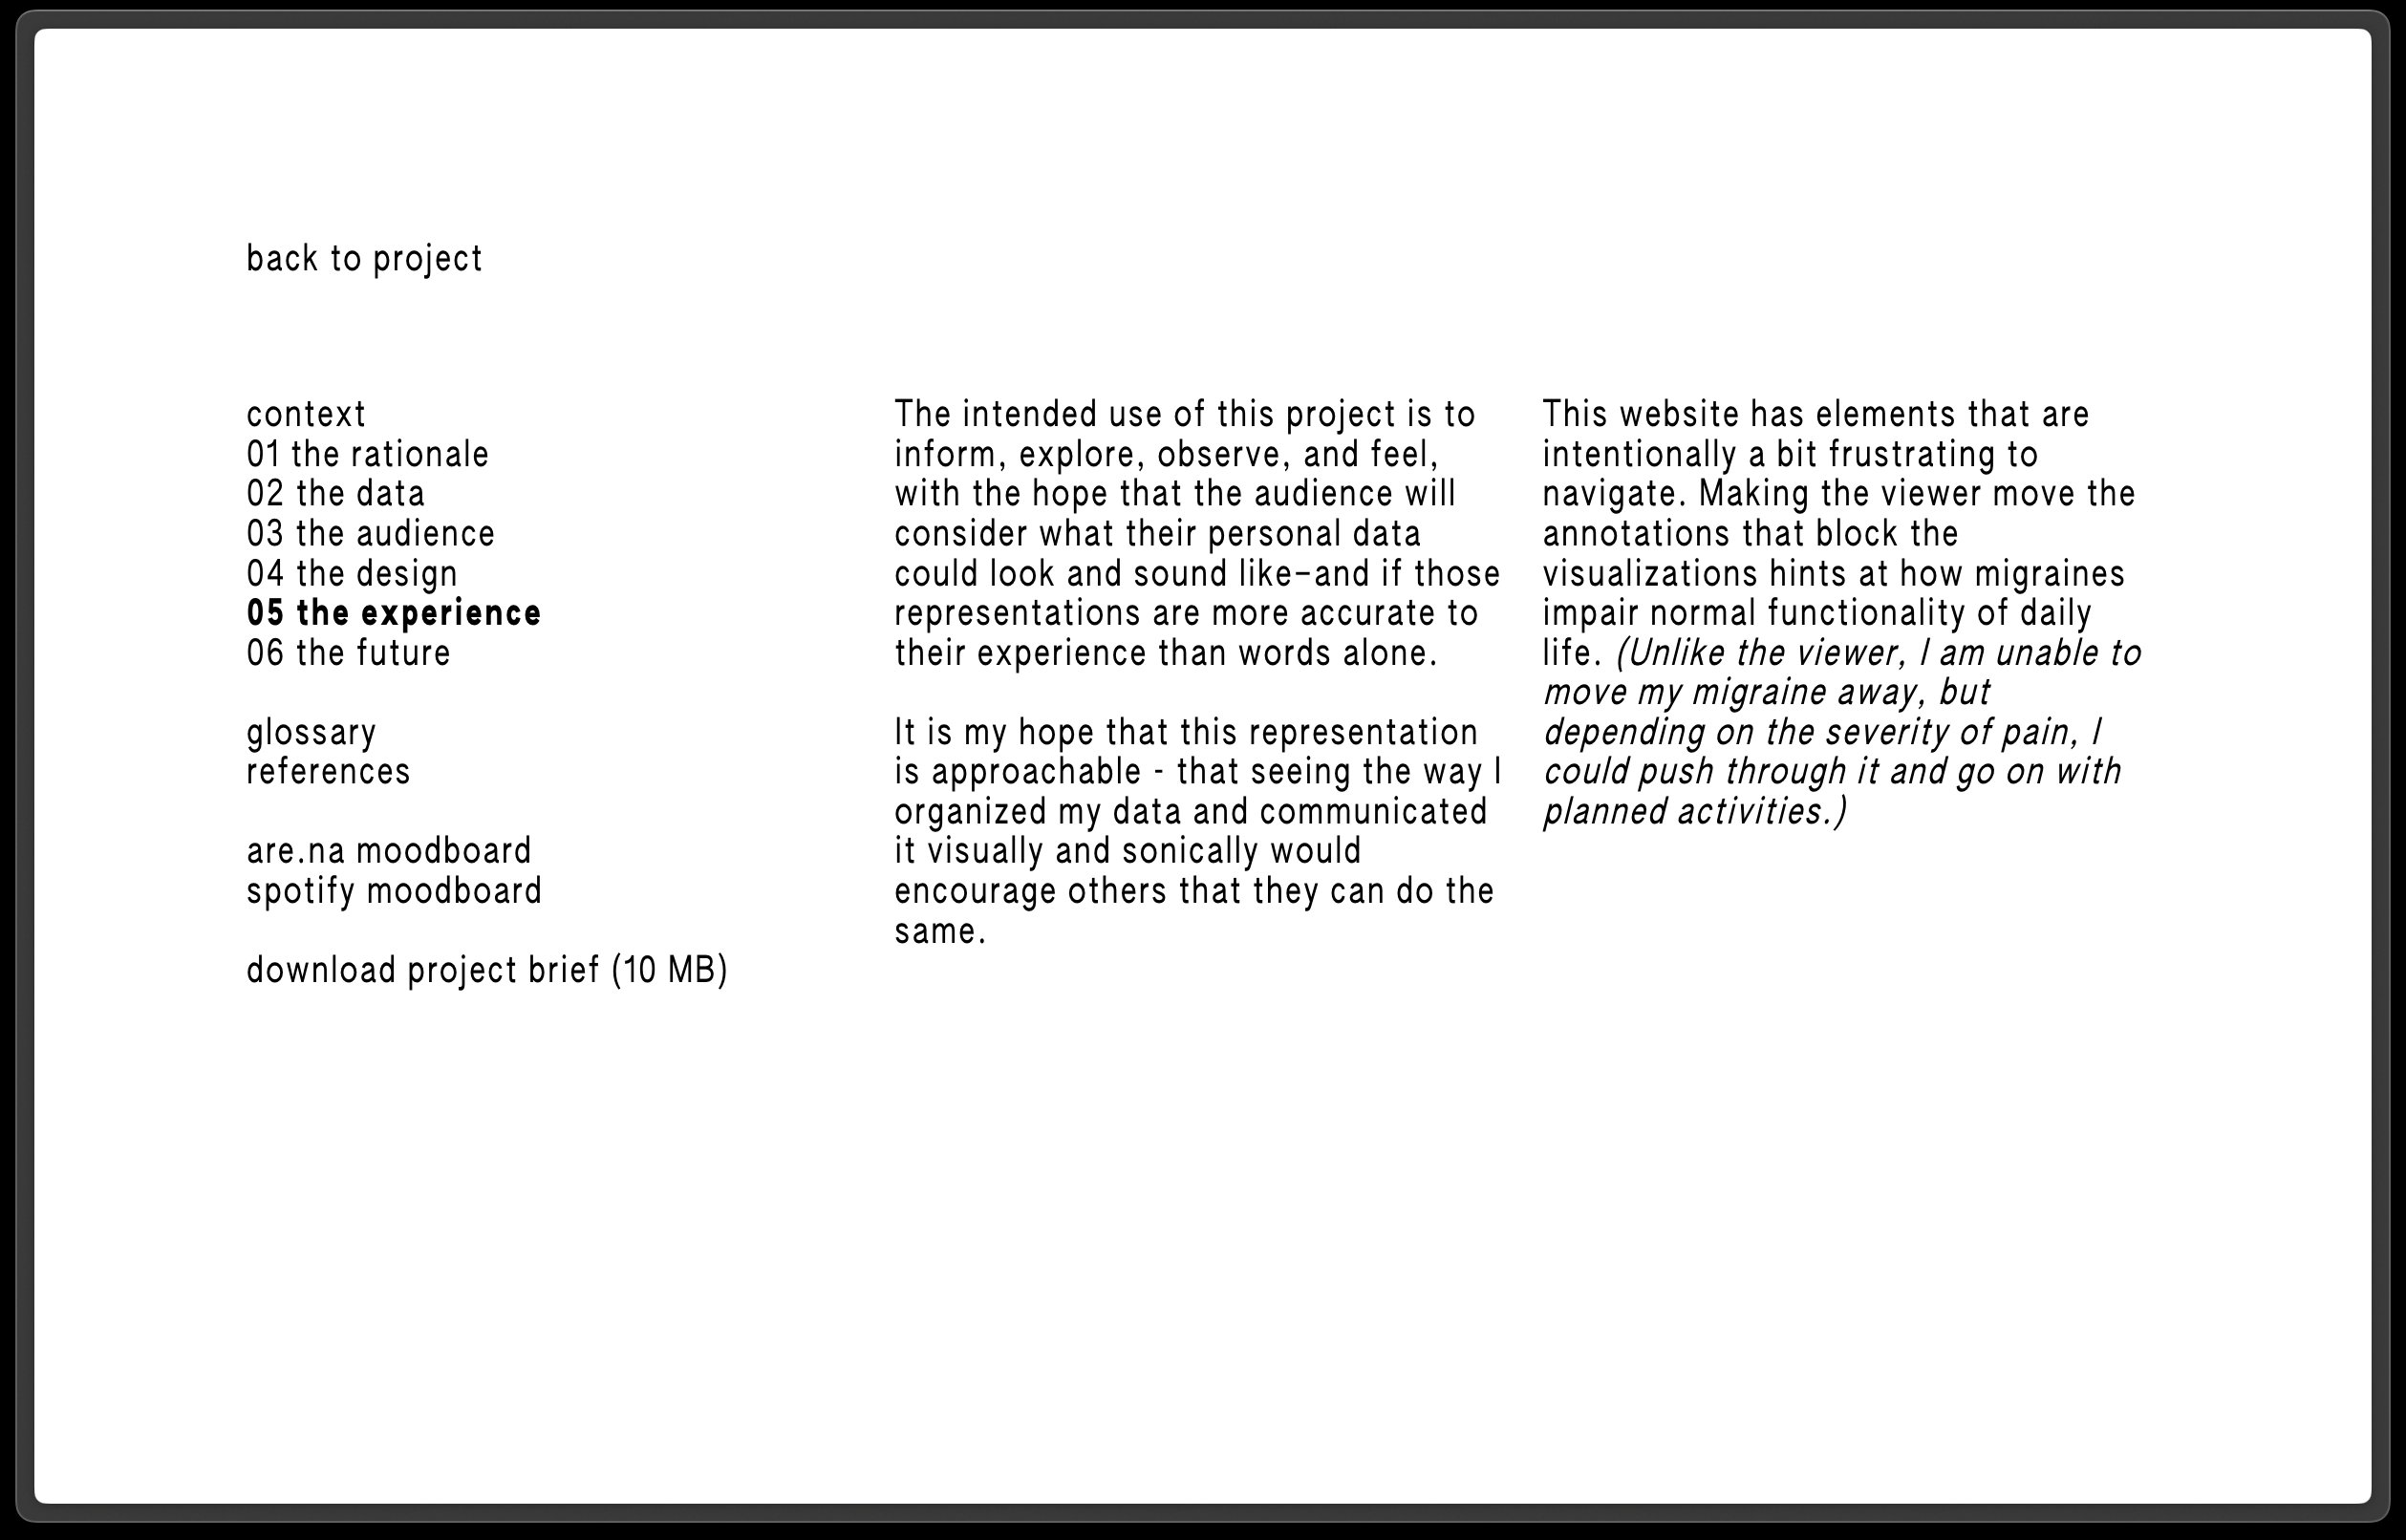
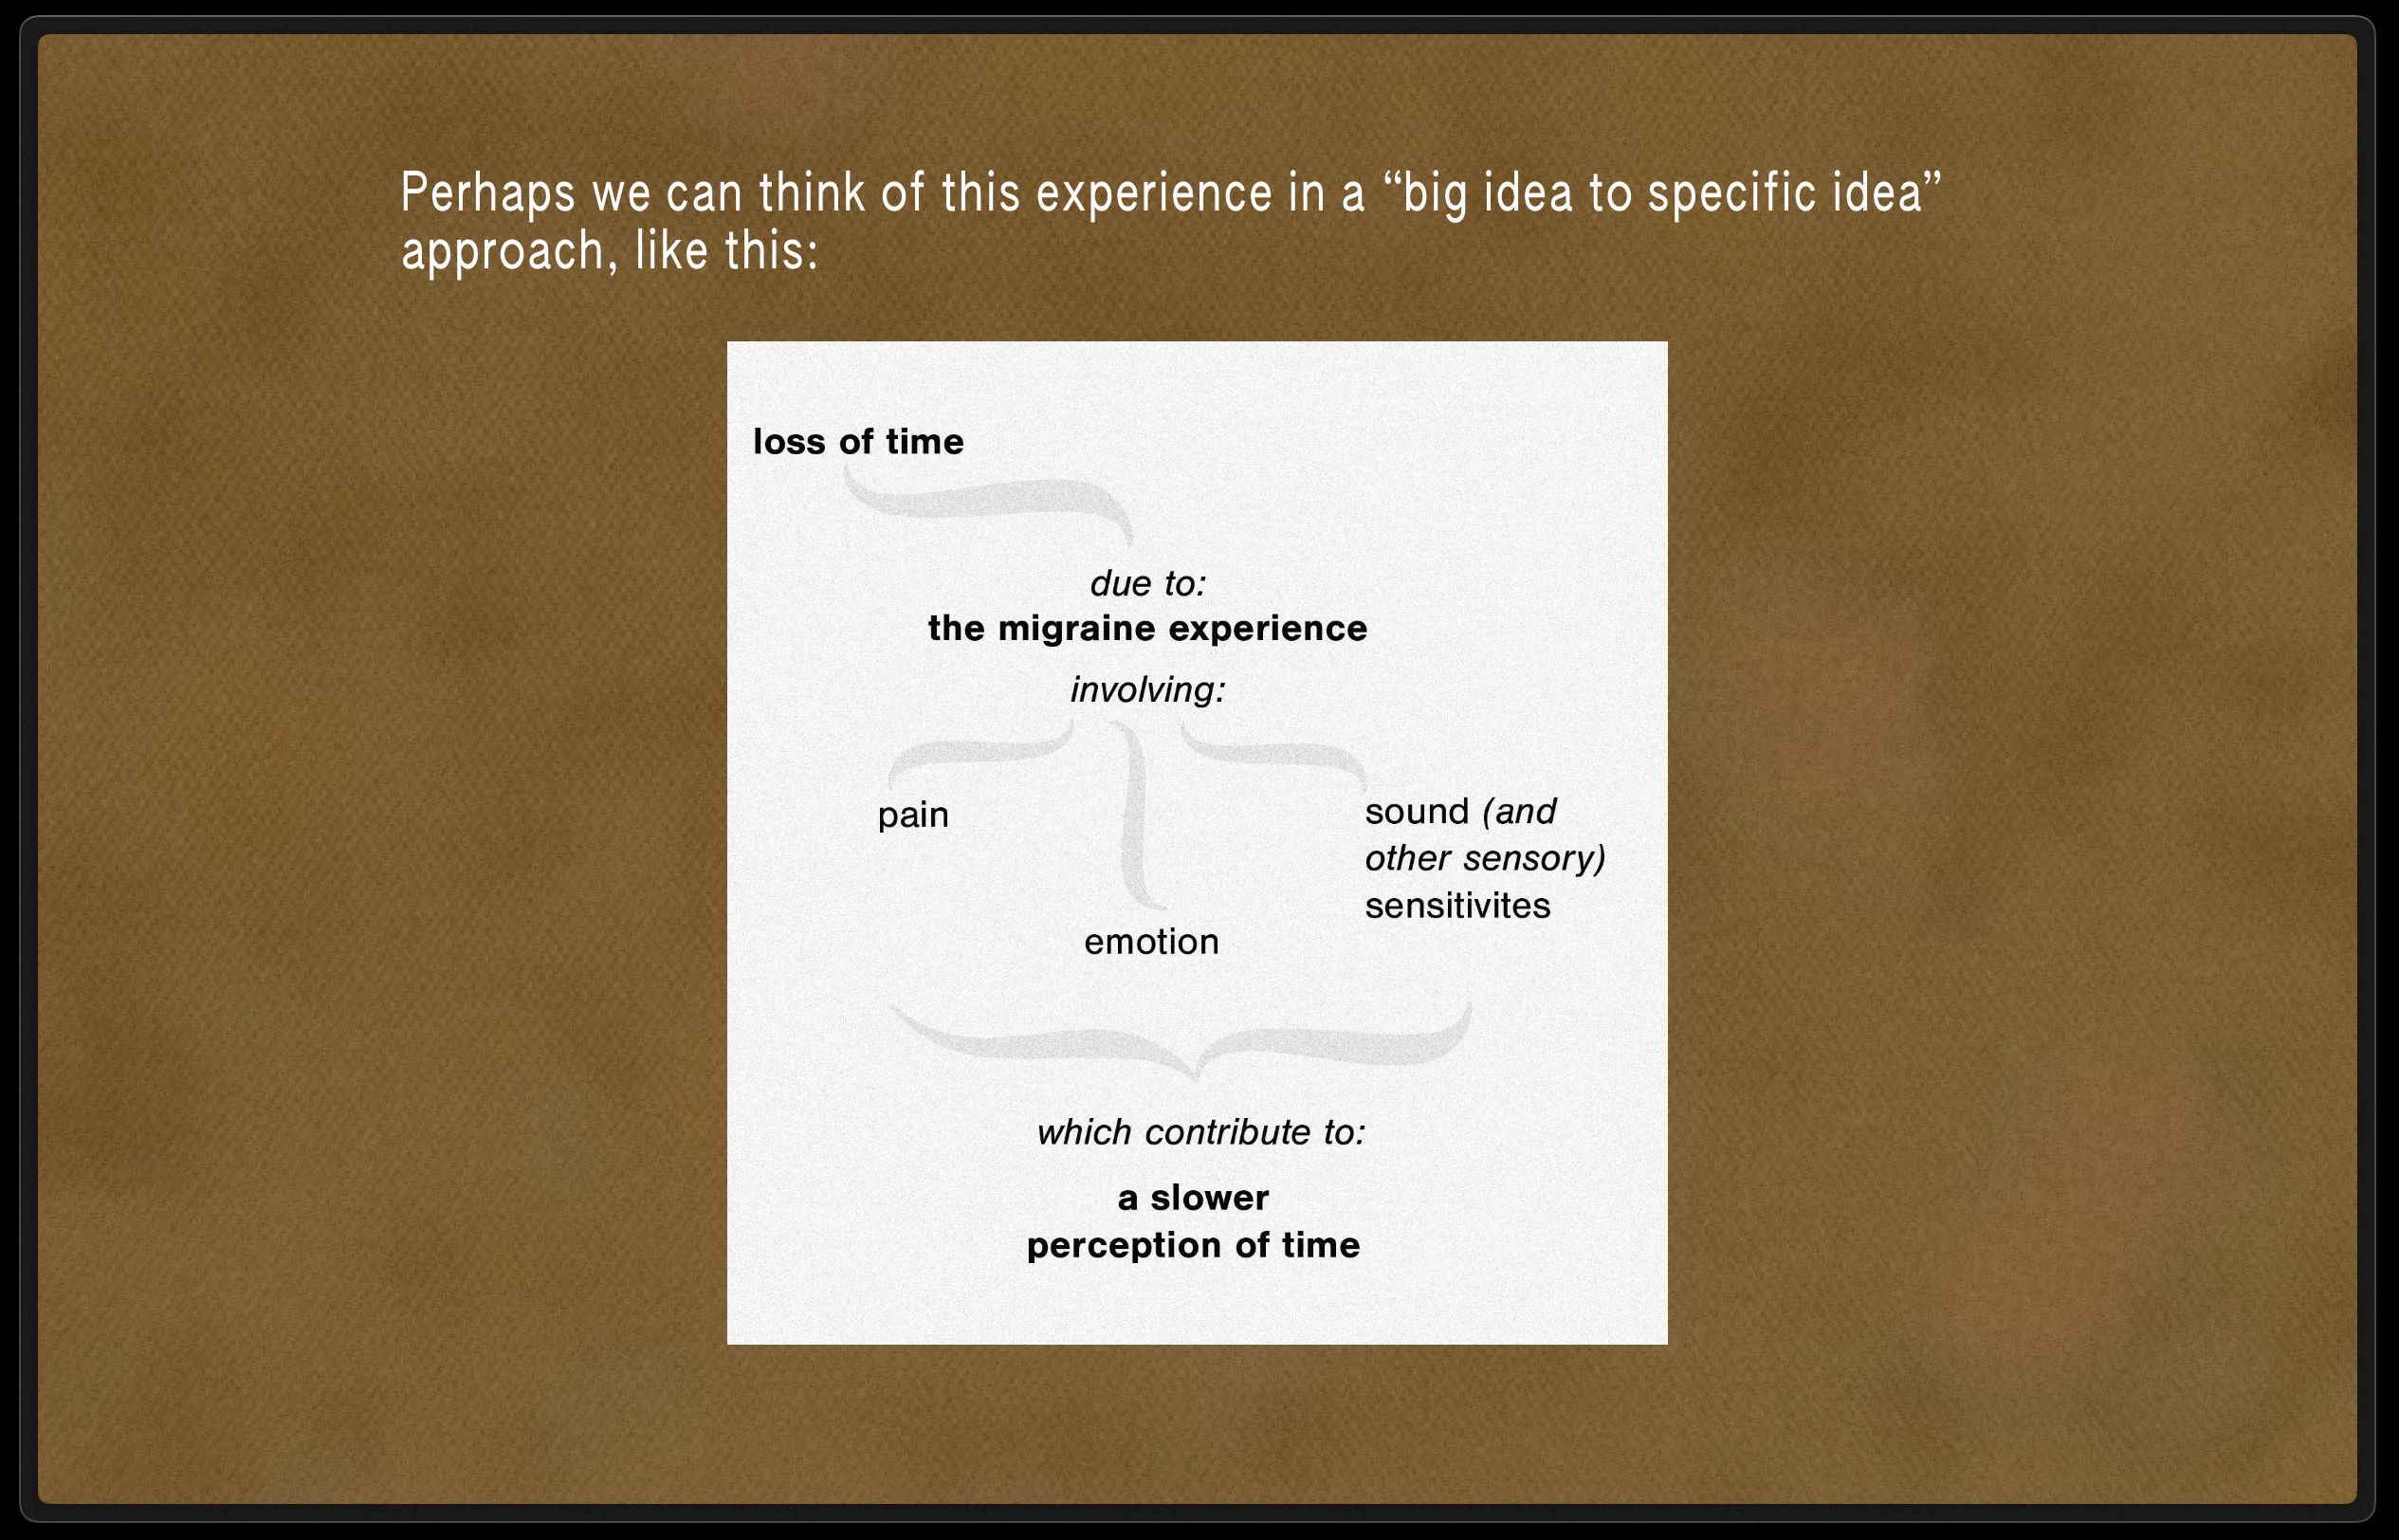
Clicking back to the project, the viewer is confronted with rhetorical questions and pieces of my thought process that resulted from my migraine experience, with special attention to perception of time in and out of pain.
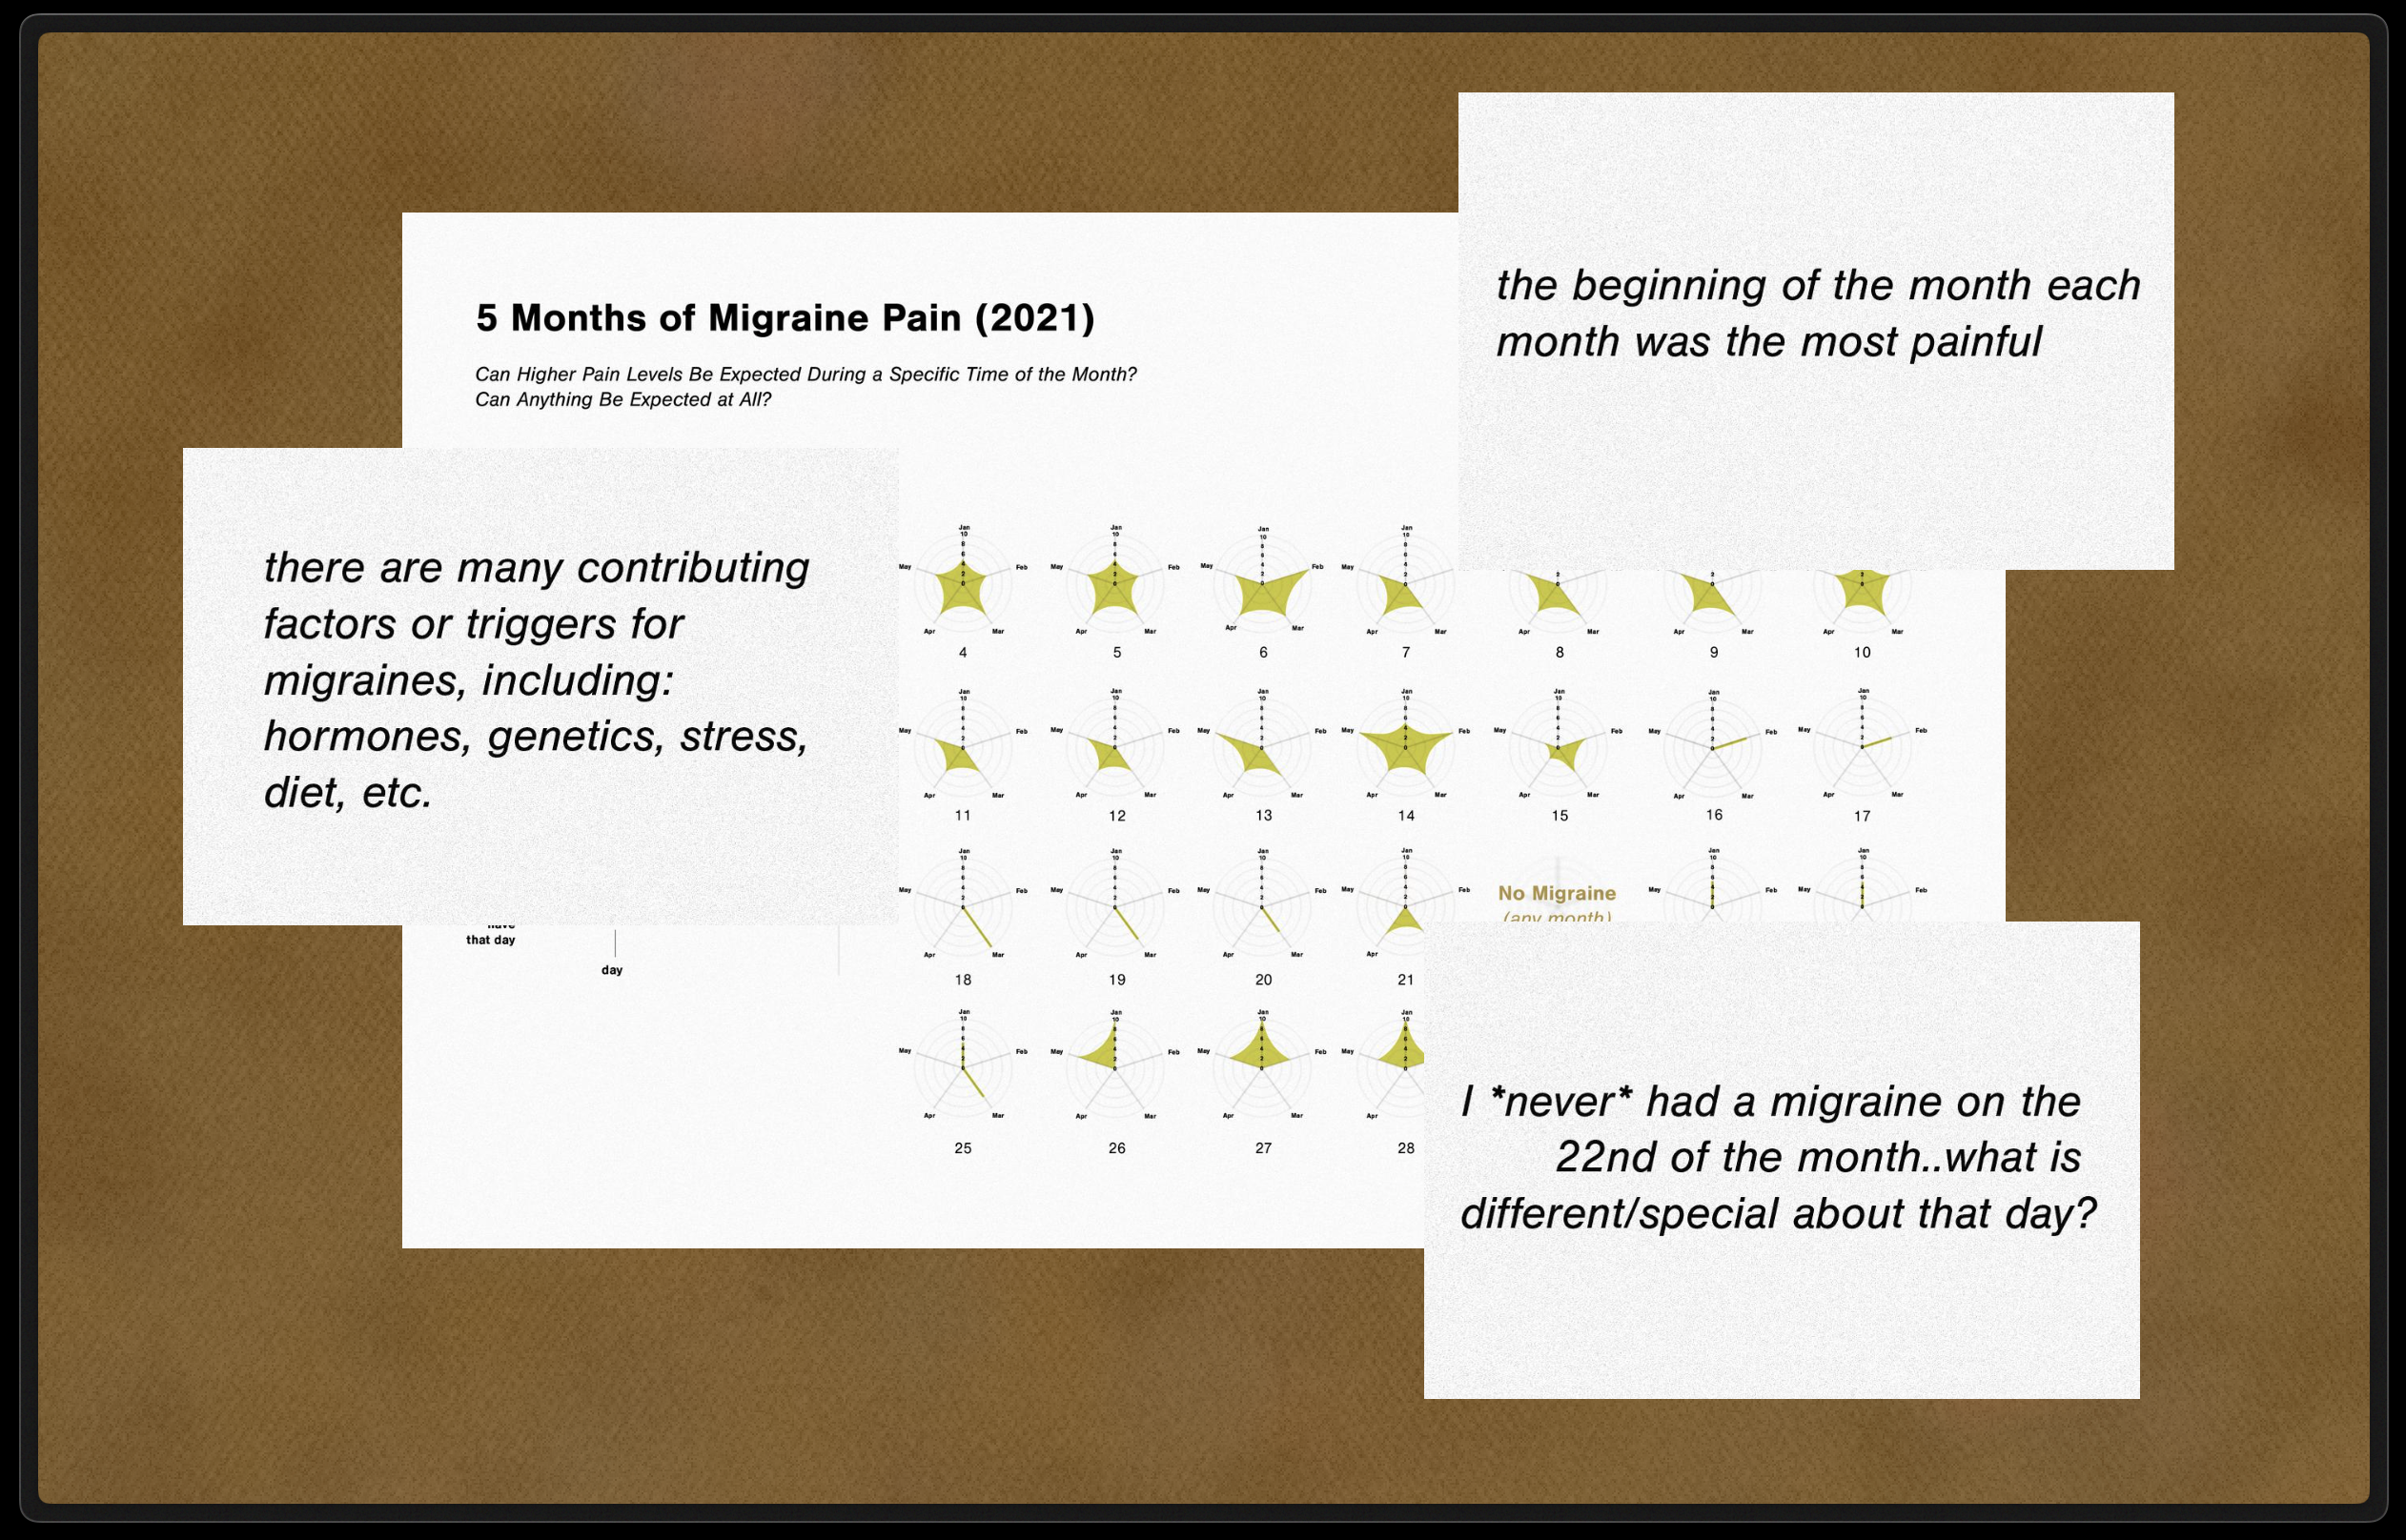
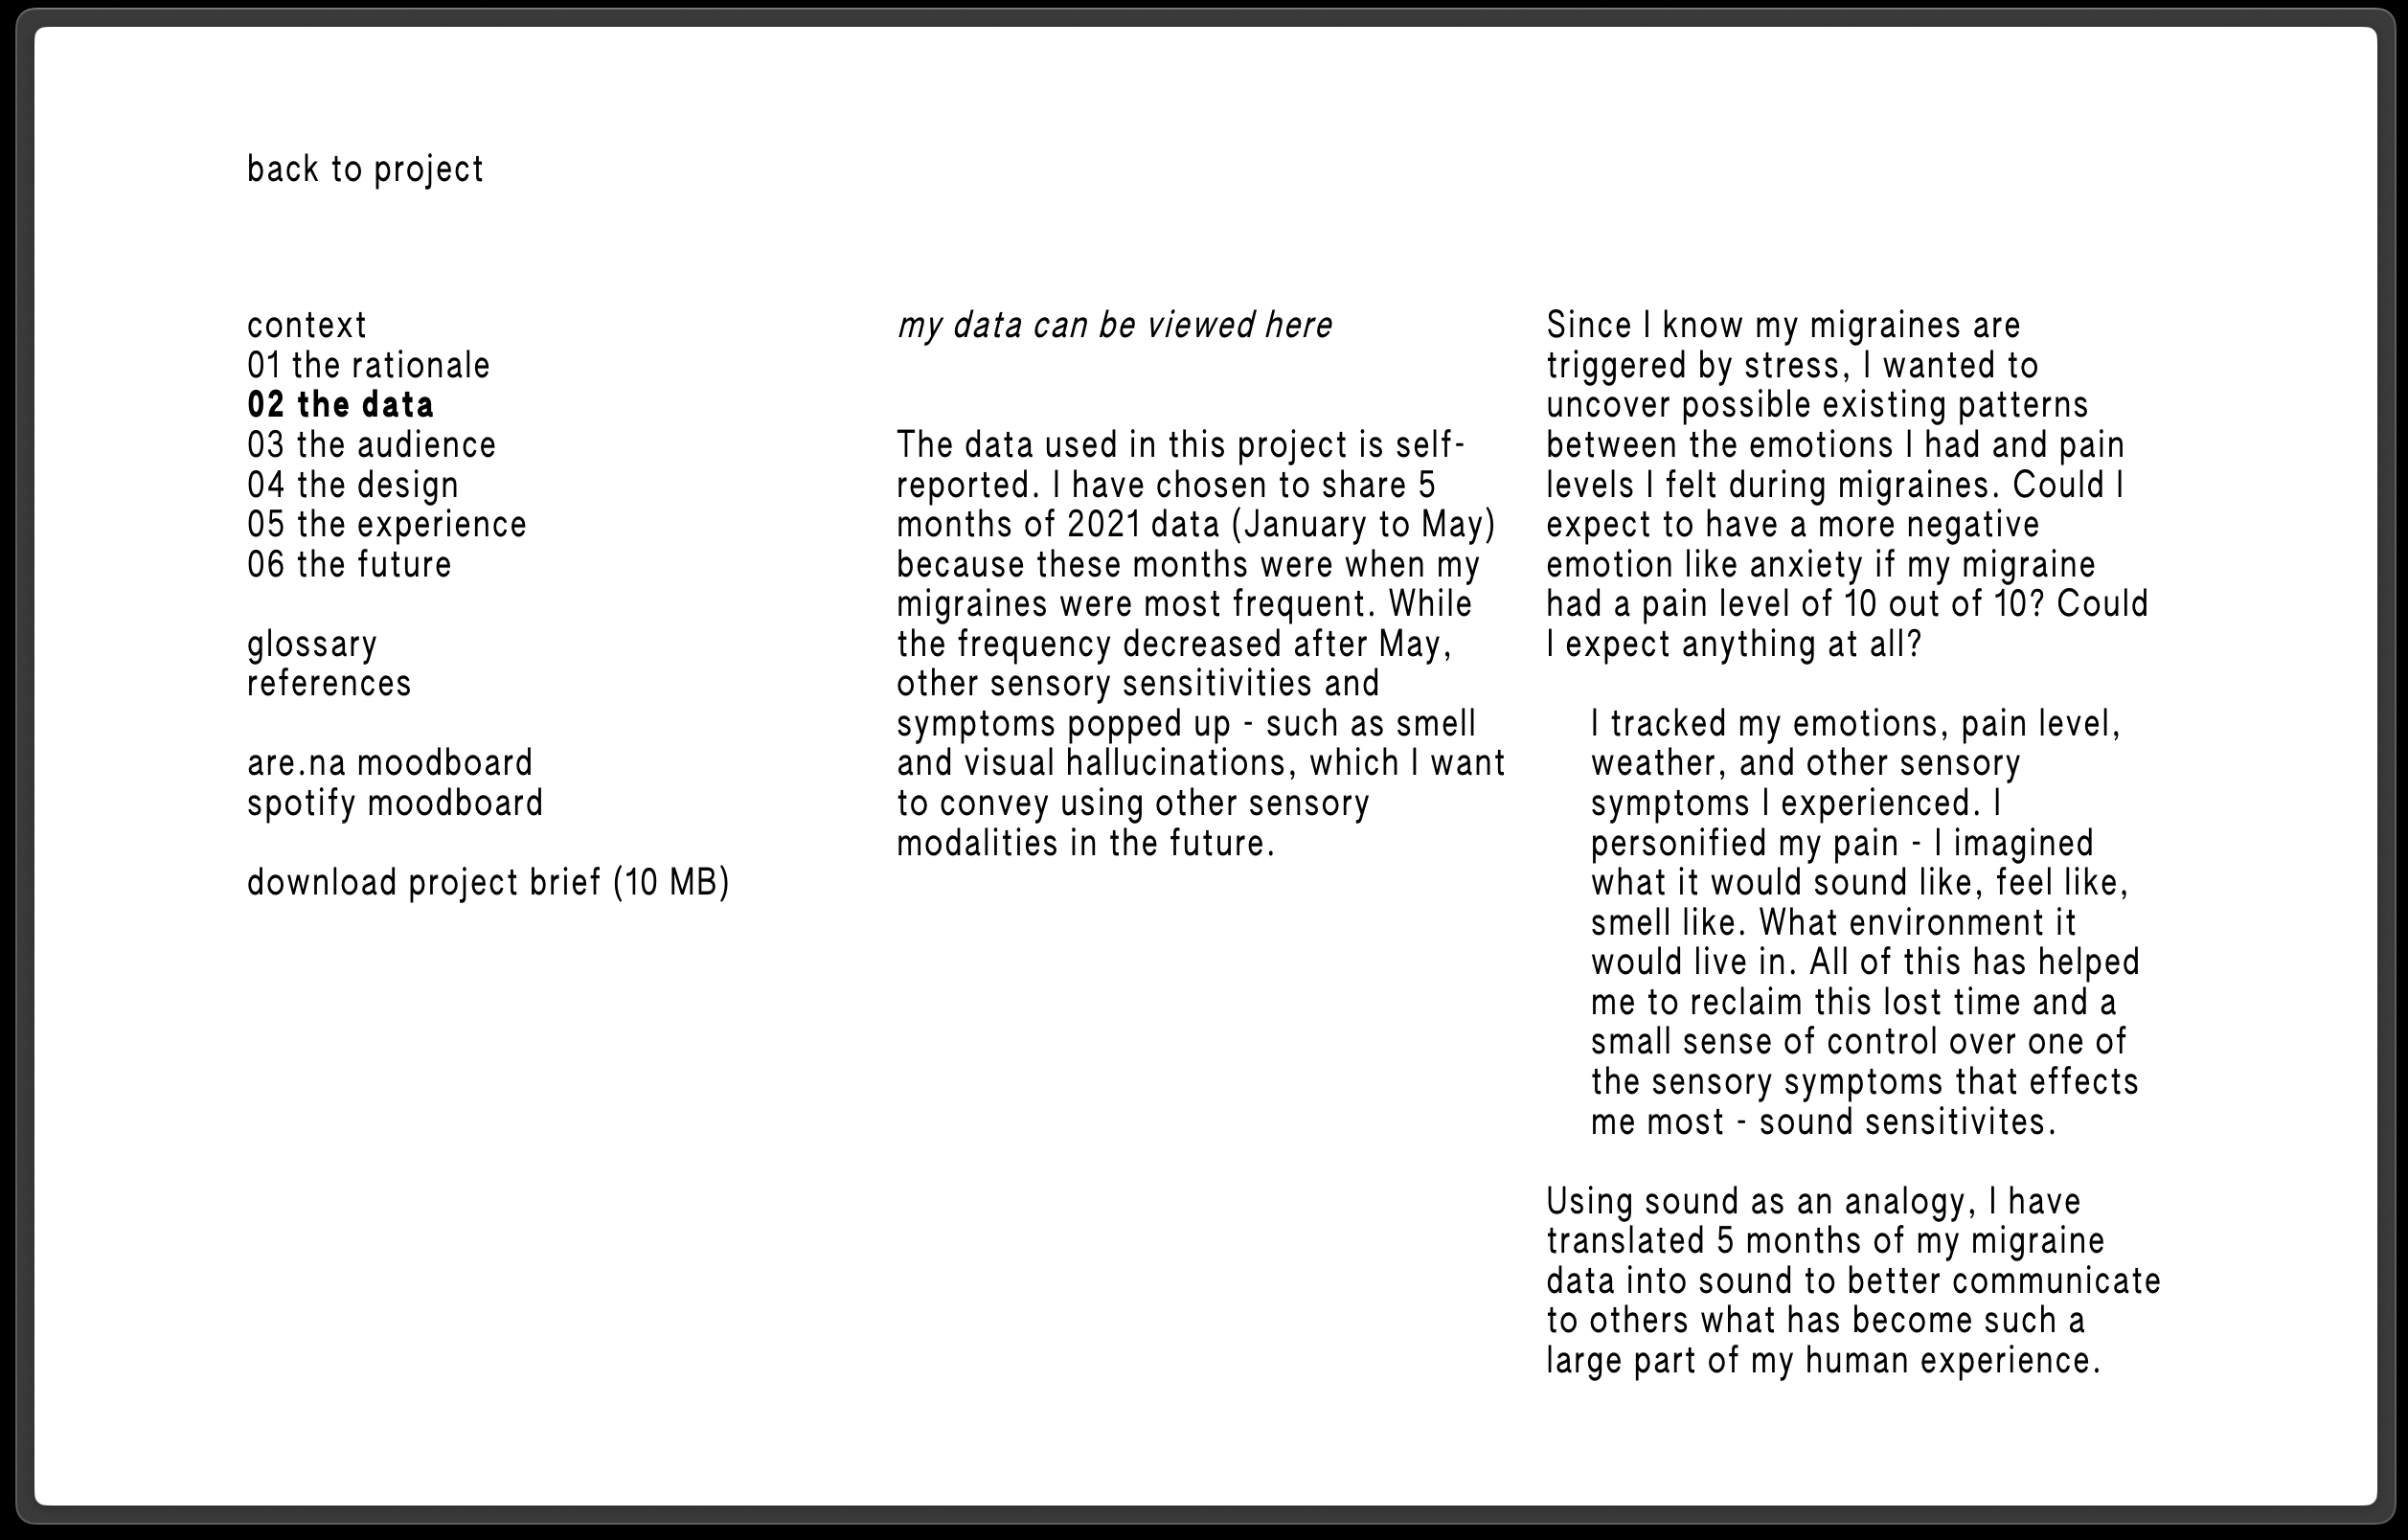
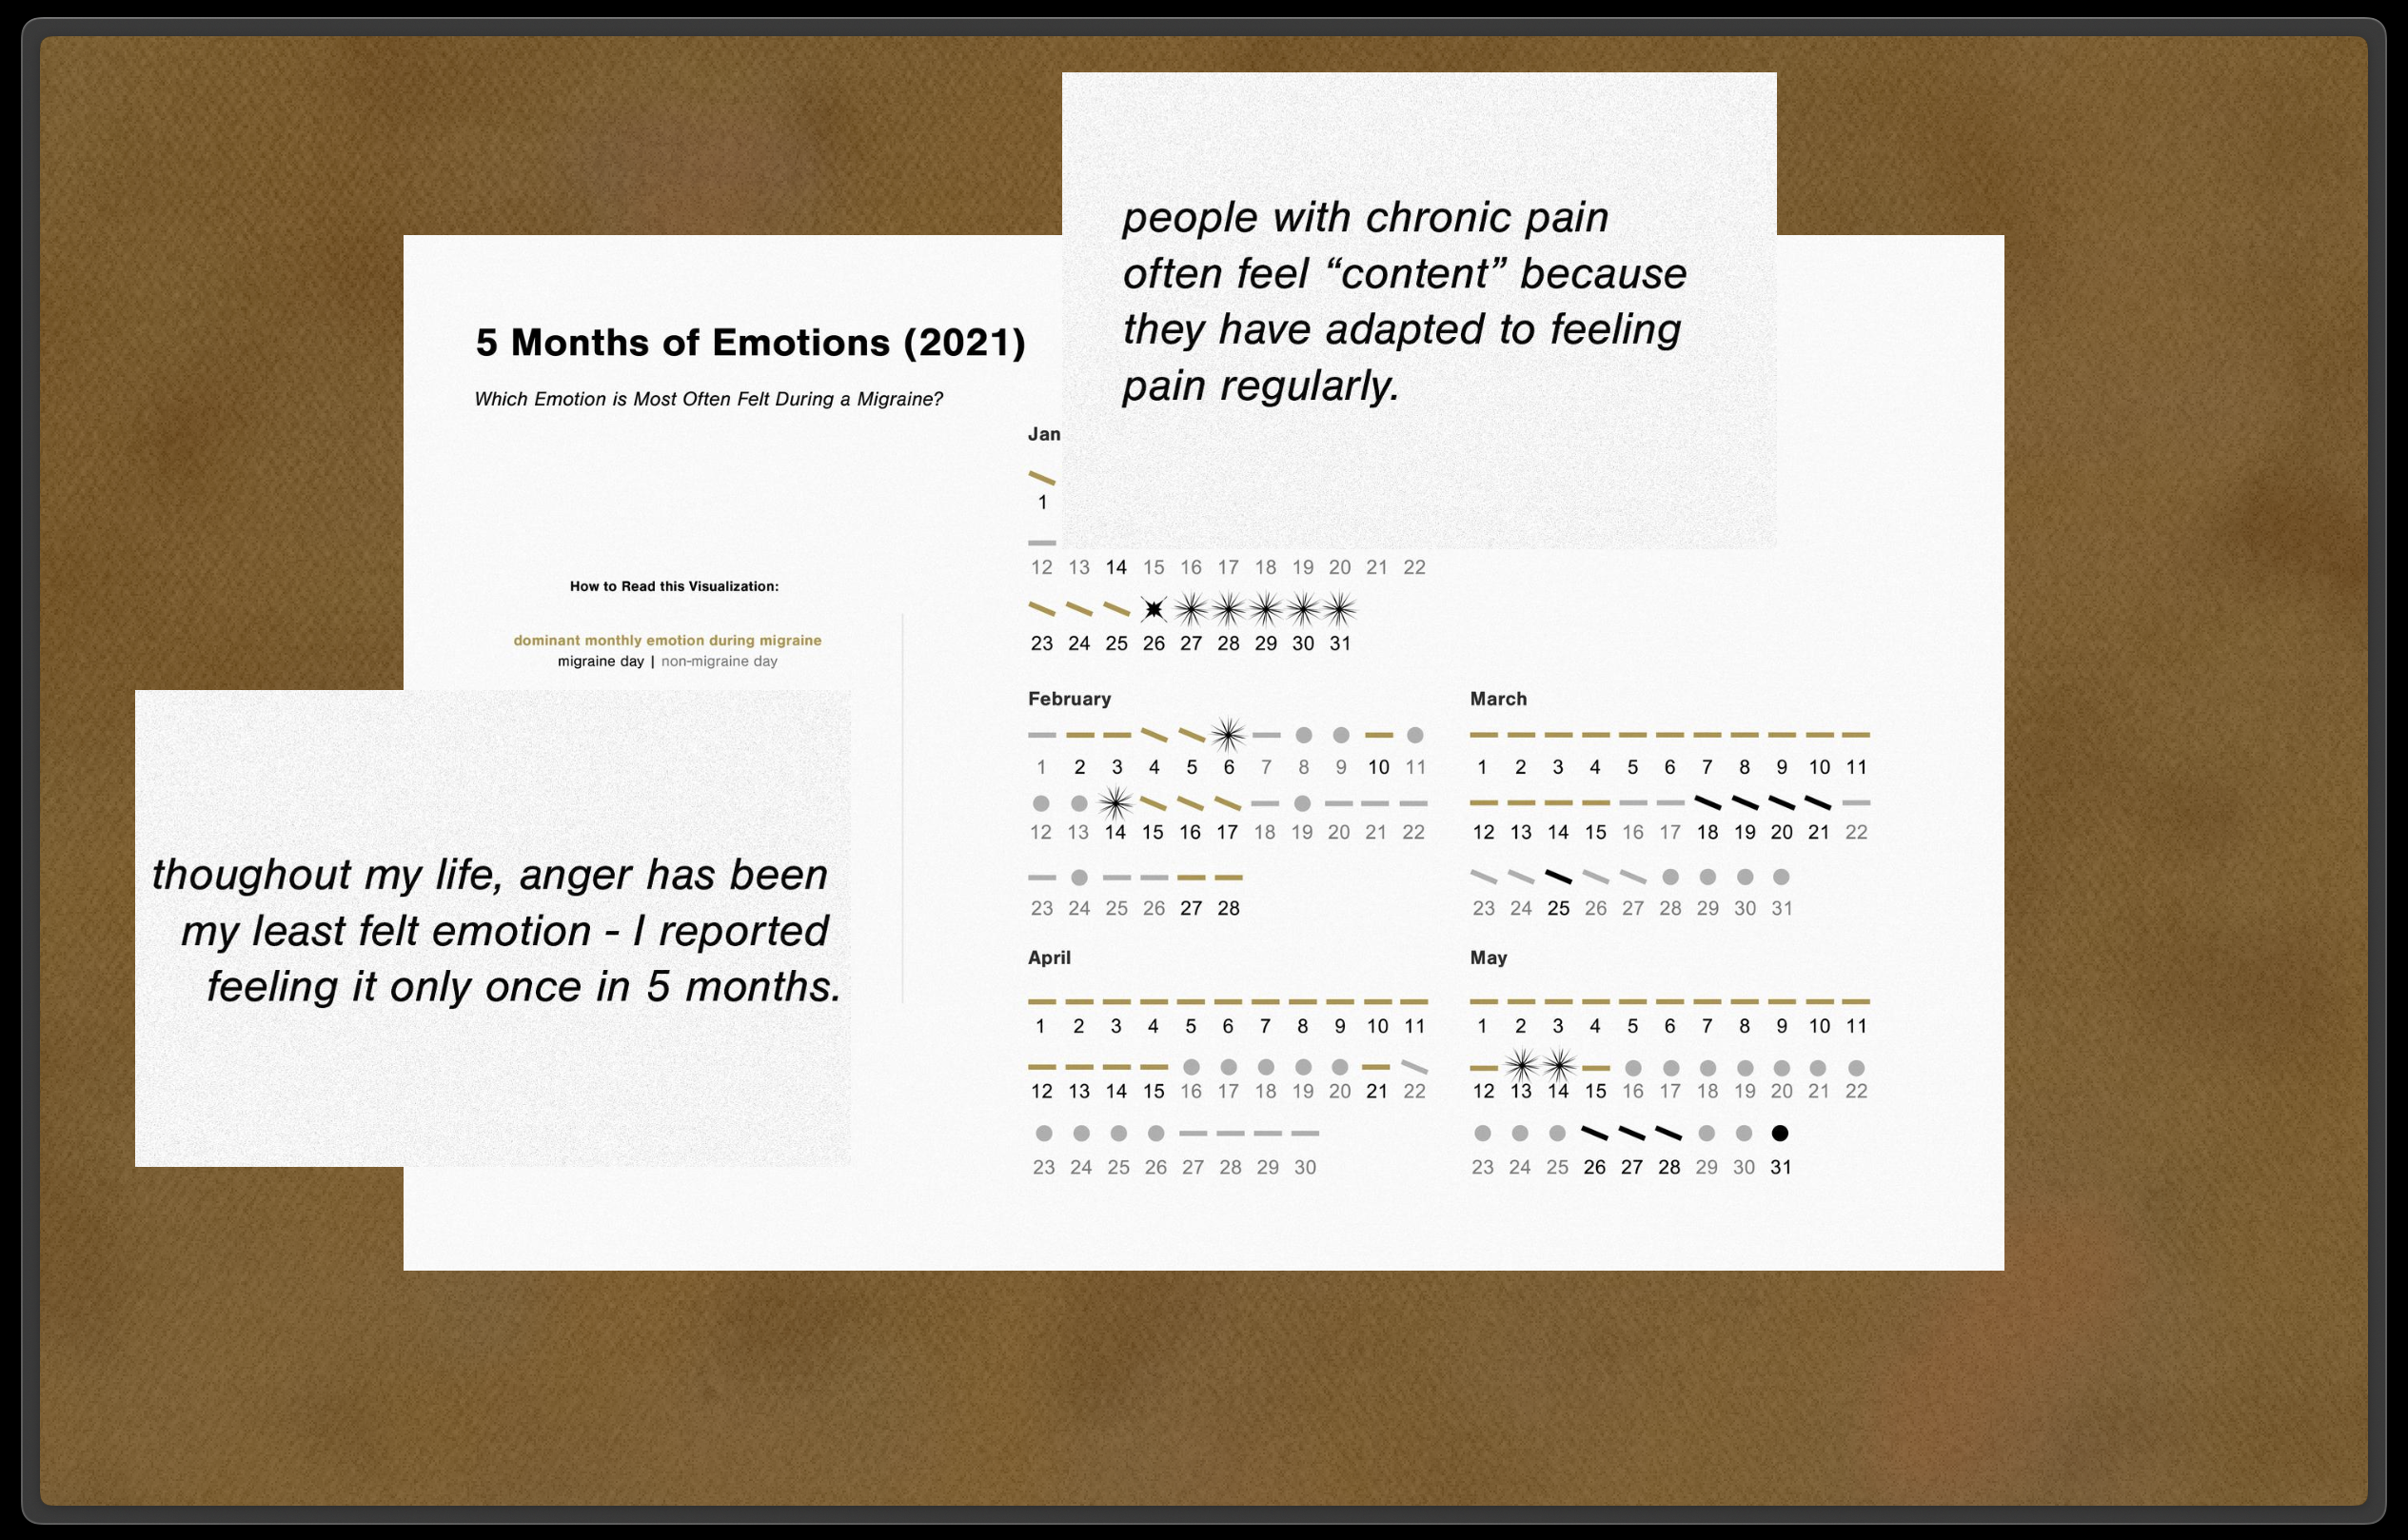
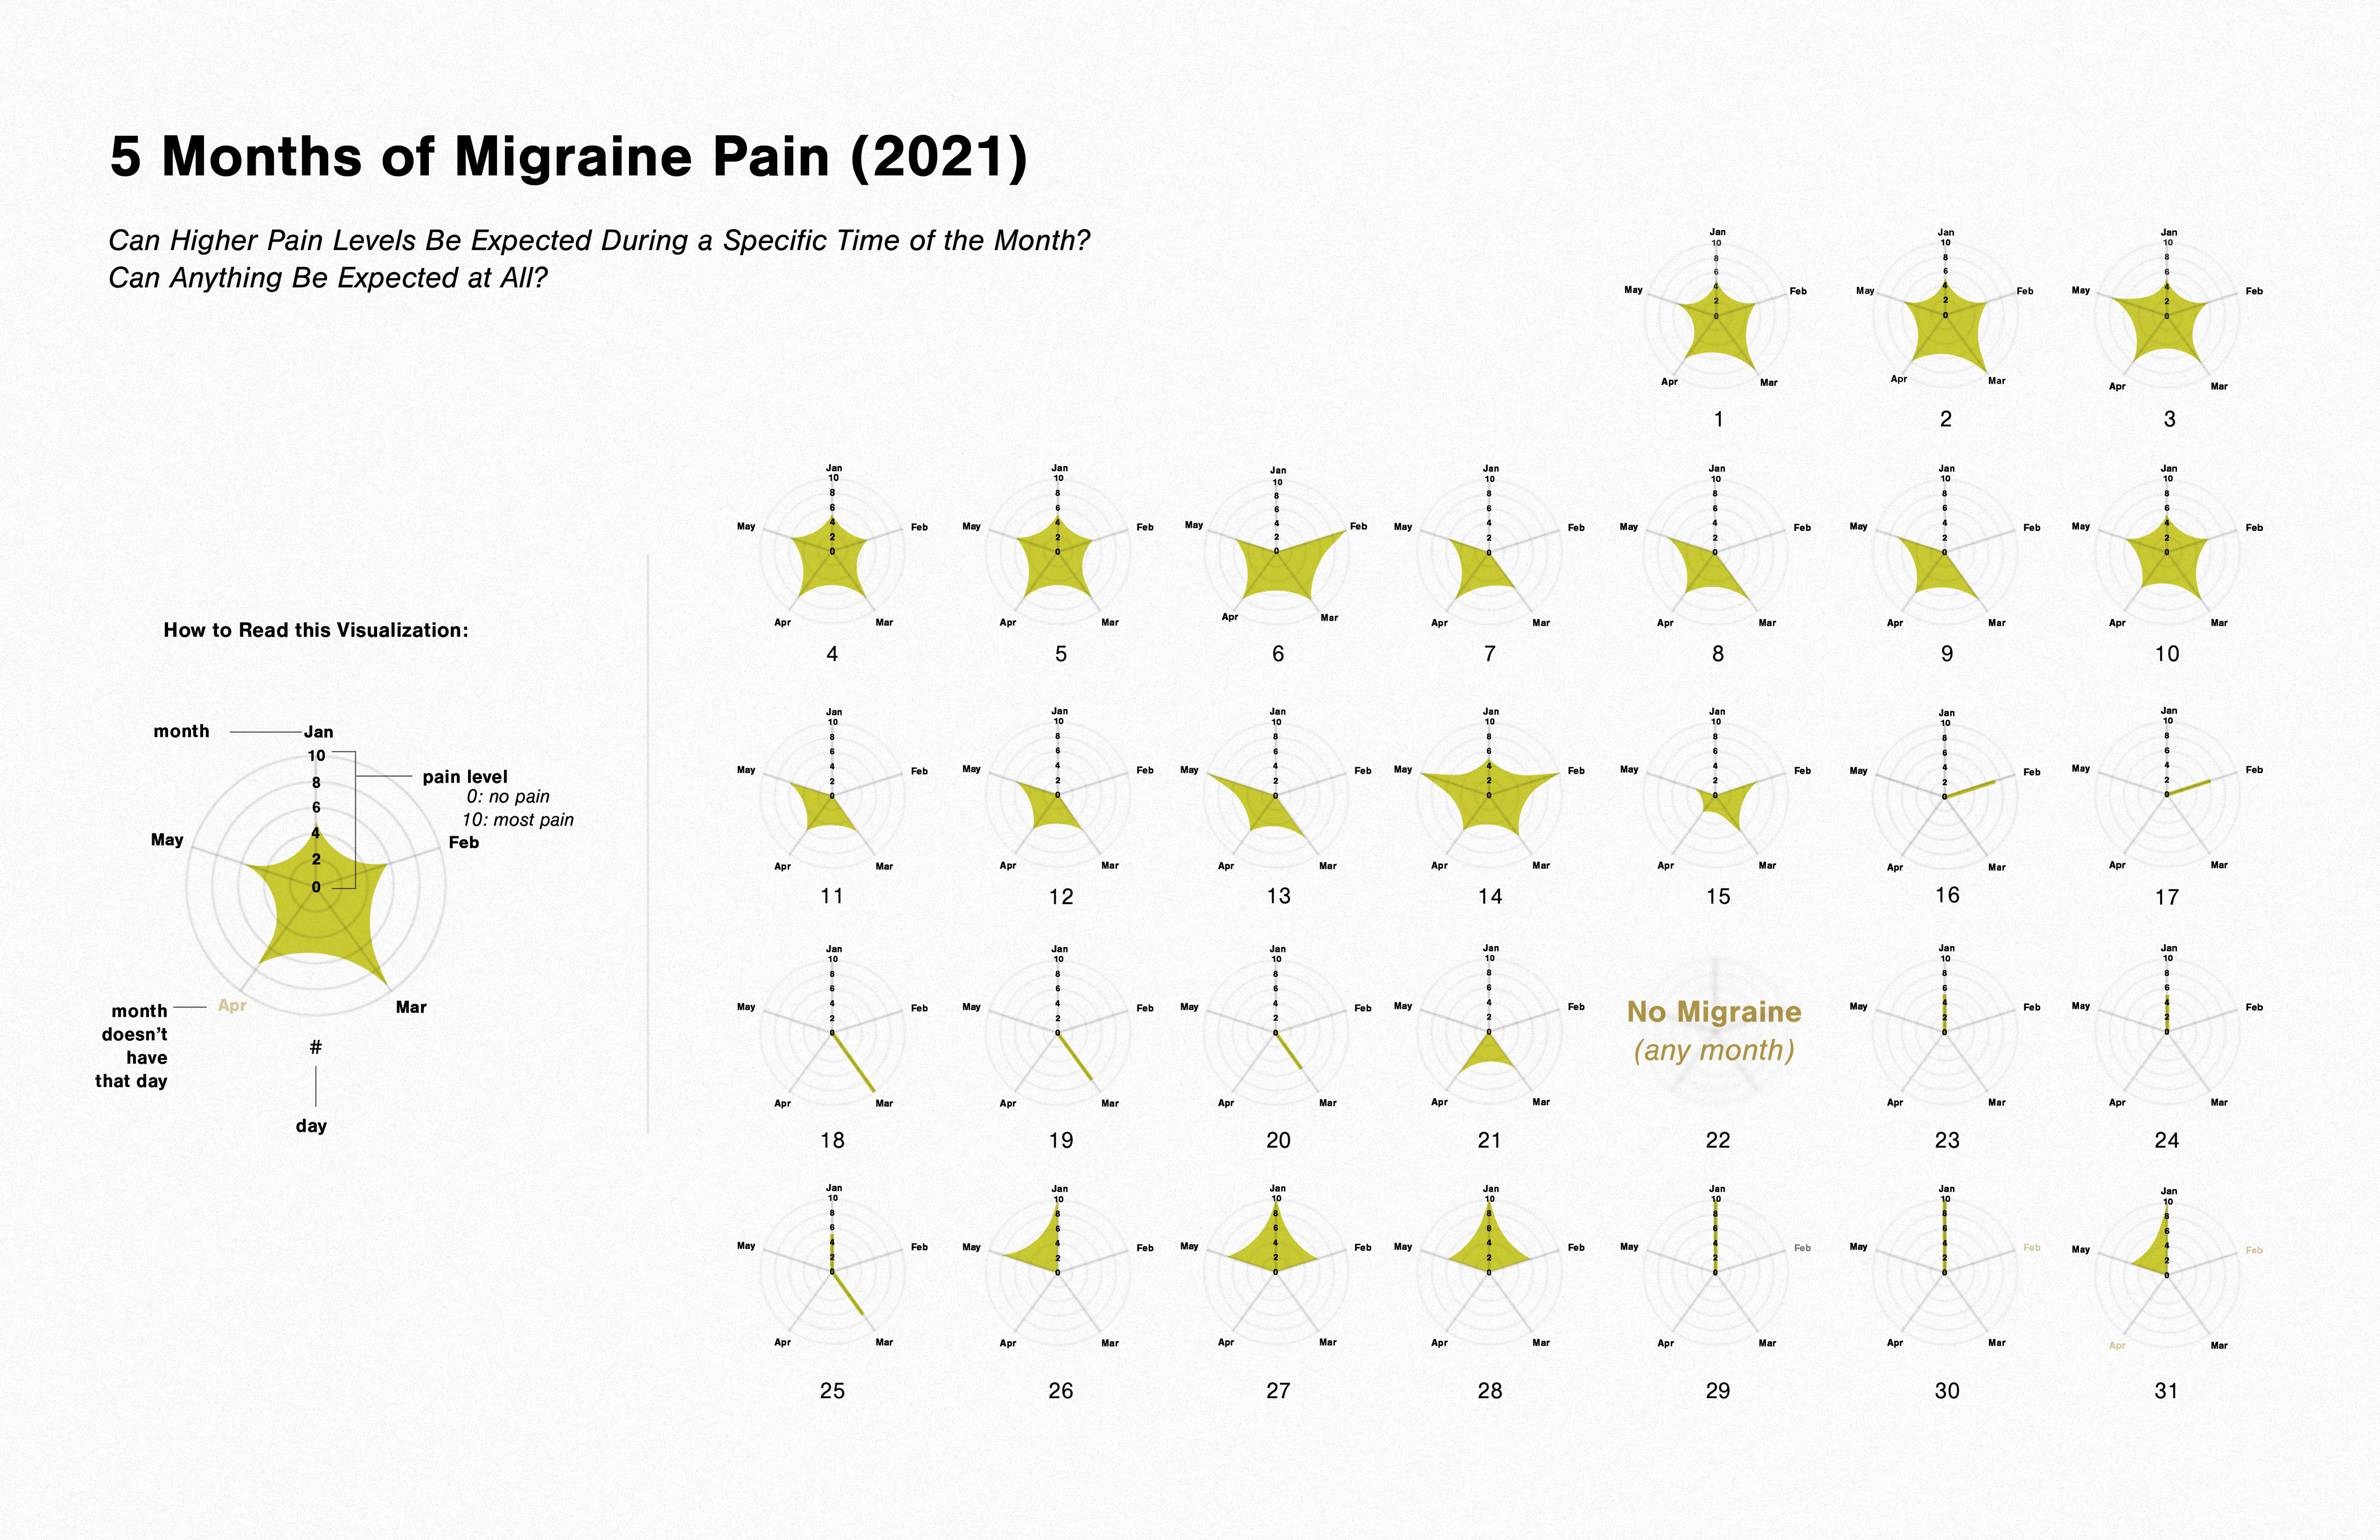
Encountering the data visualizations, the viewer would have to physically move overlapping annotations out of the way in order to read the data—a nod to how migraines and chronic pain “get in the way” of normal functionality in daily activities.

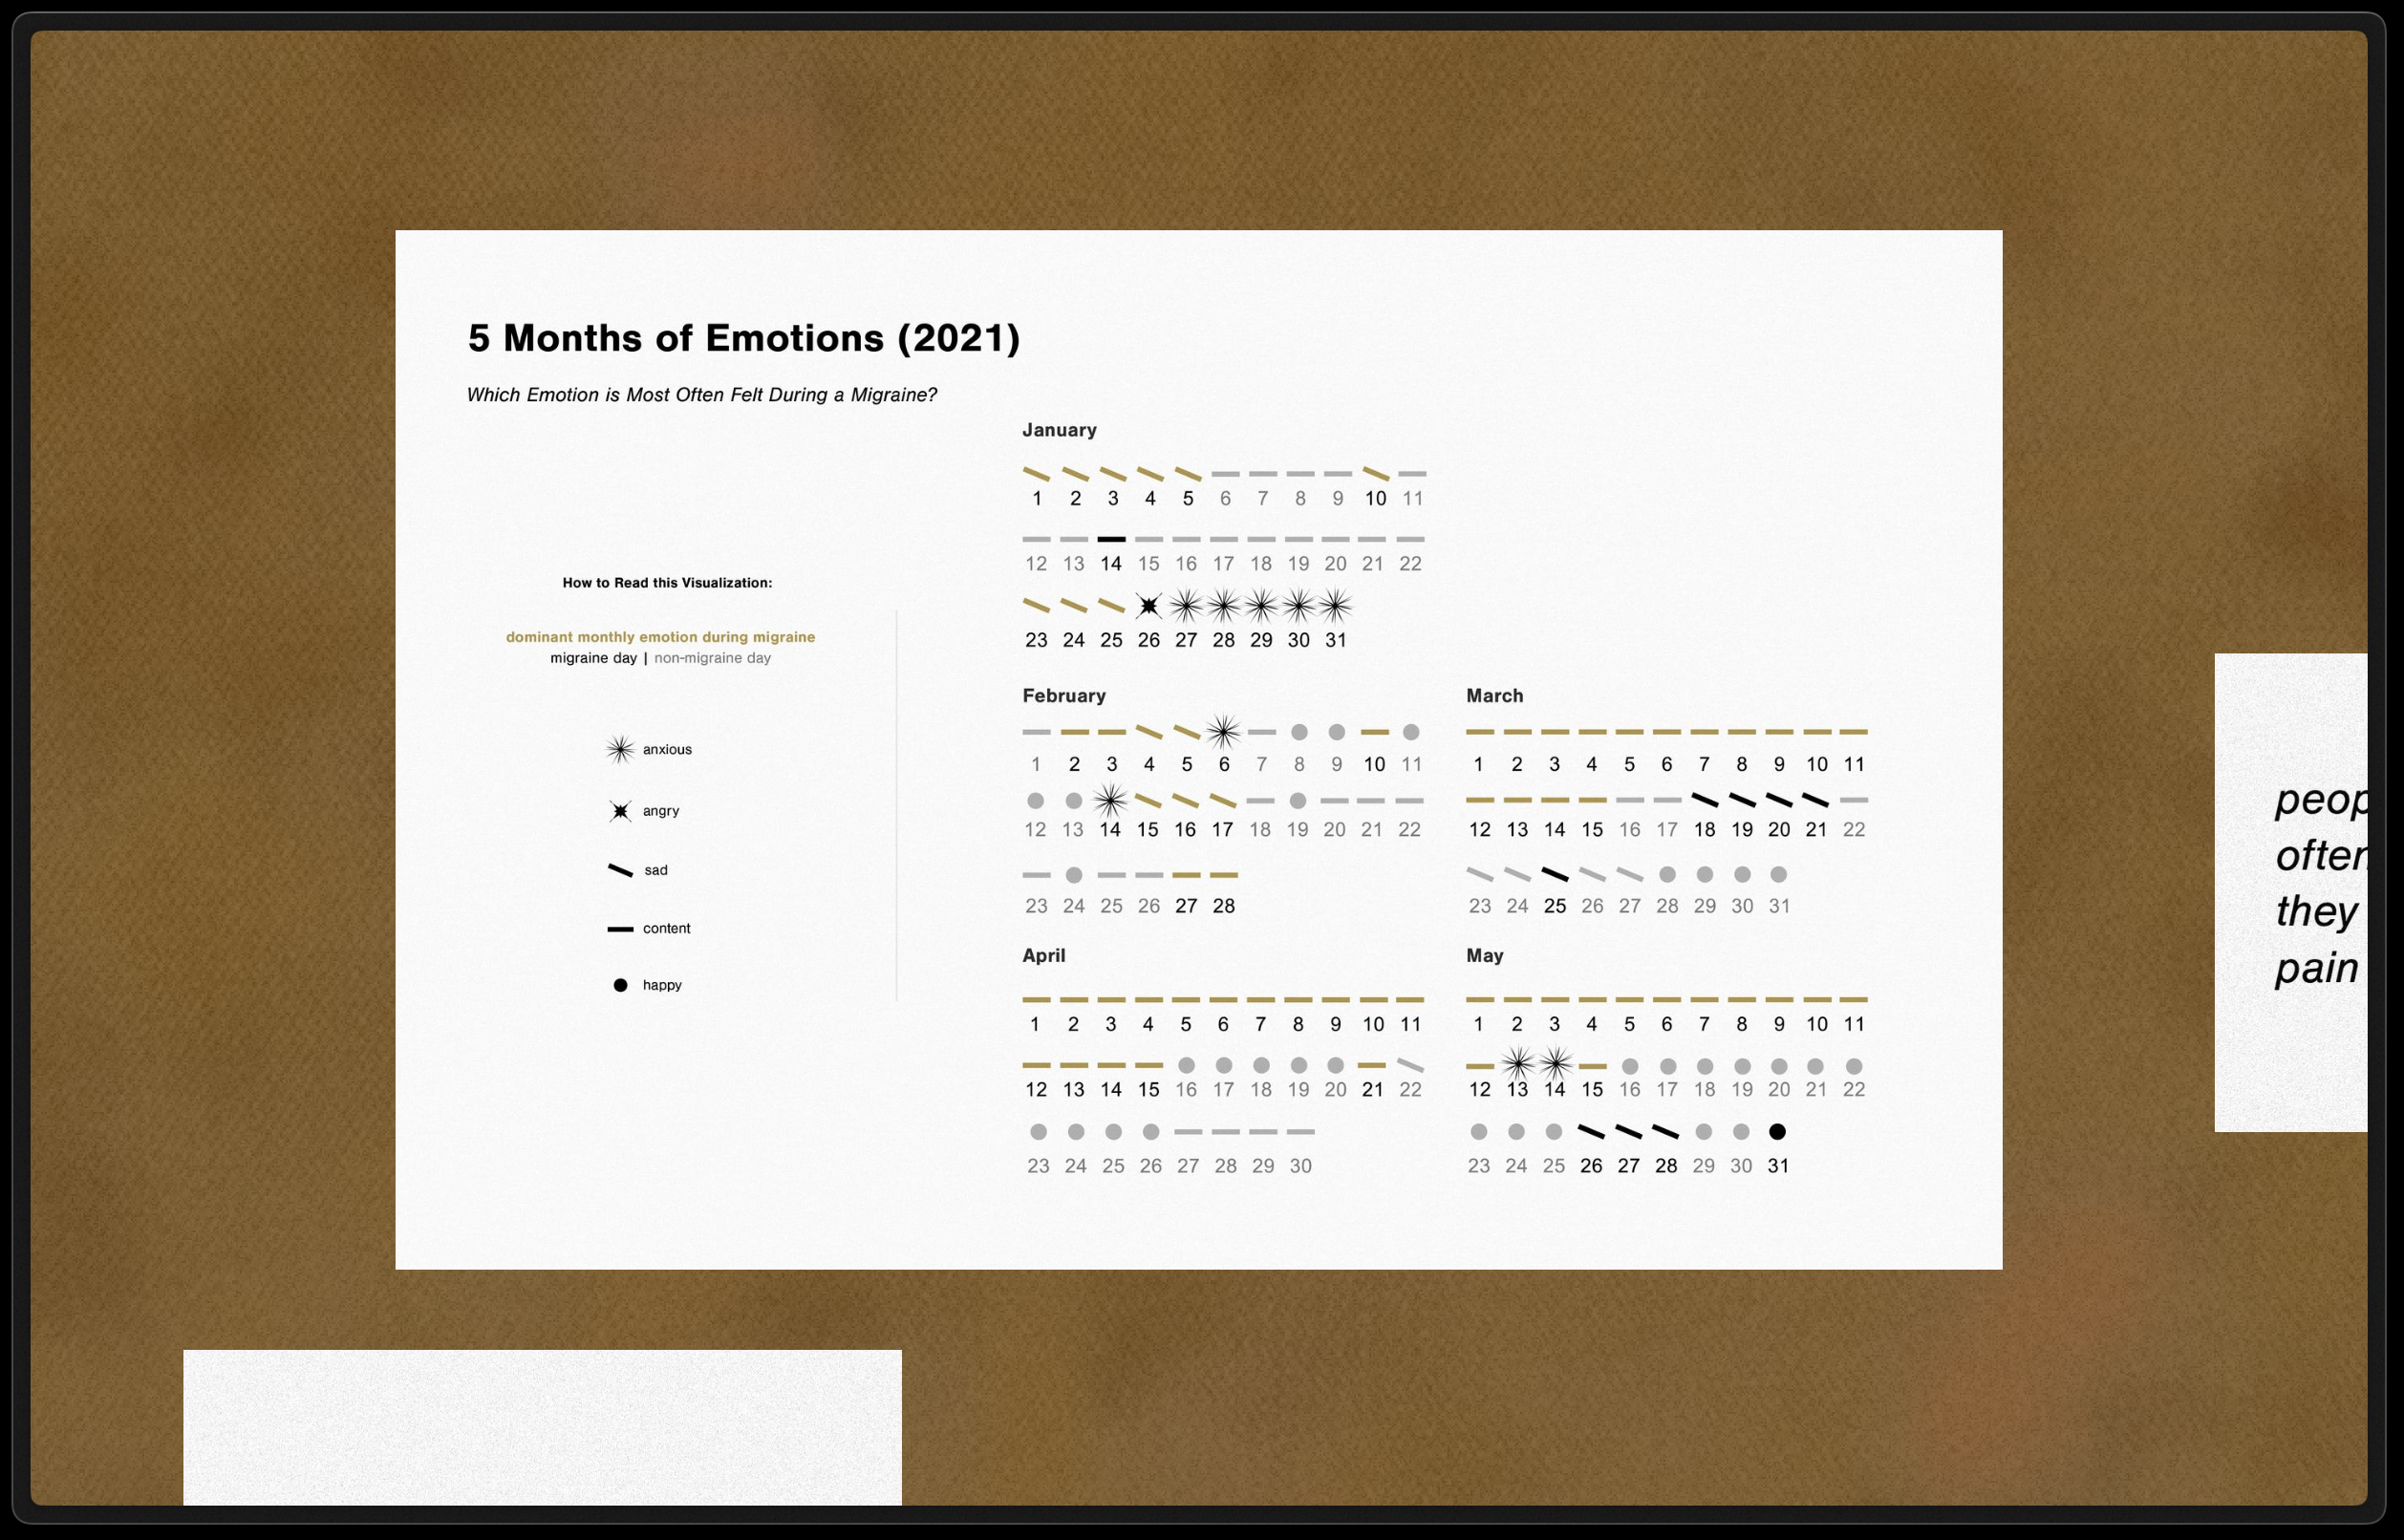
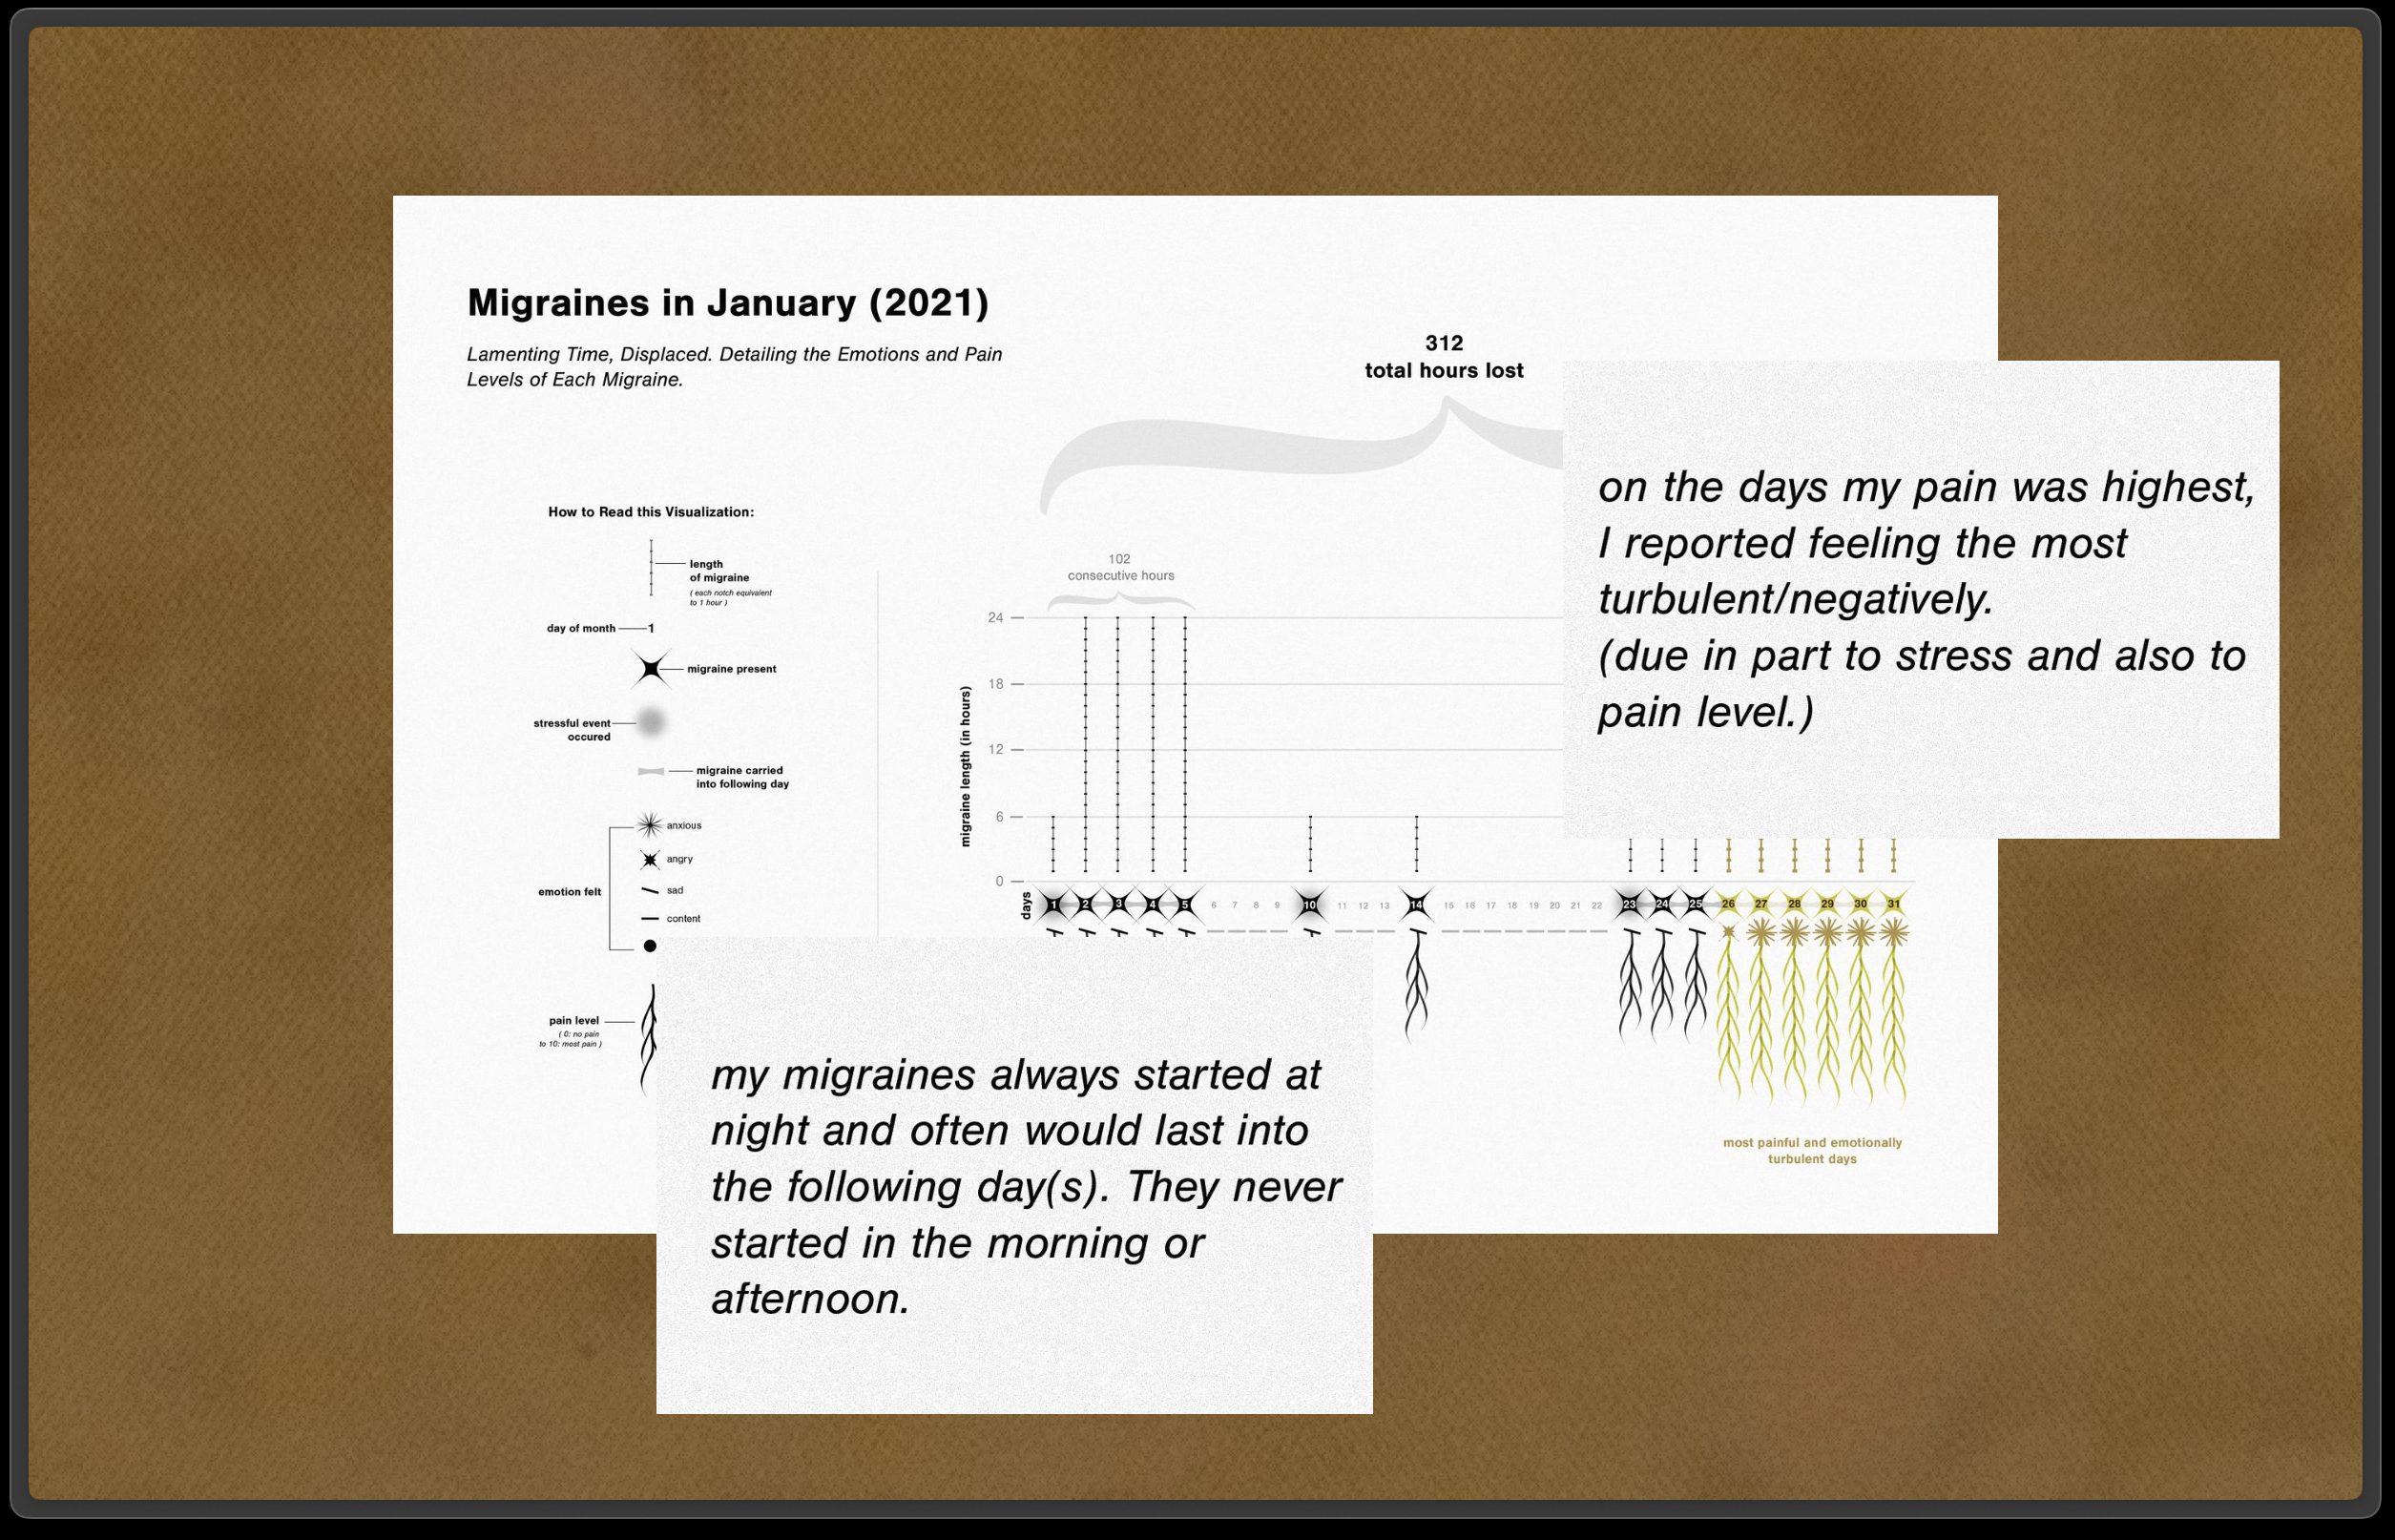
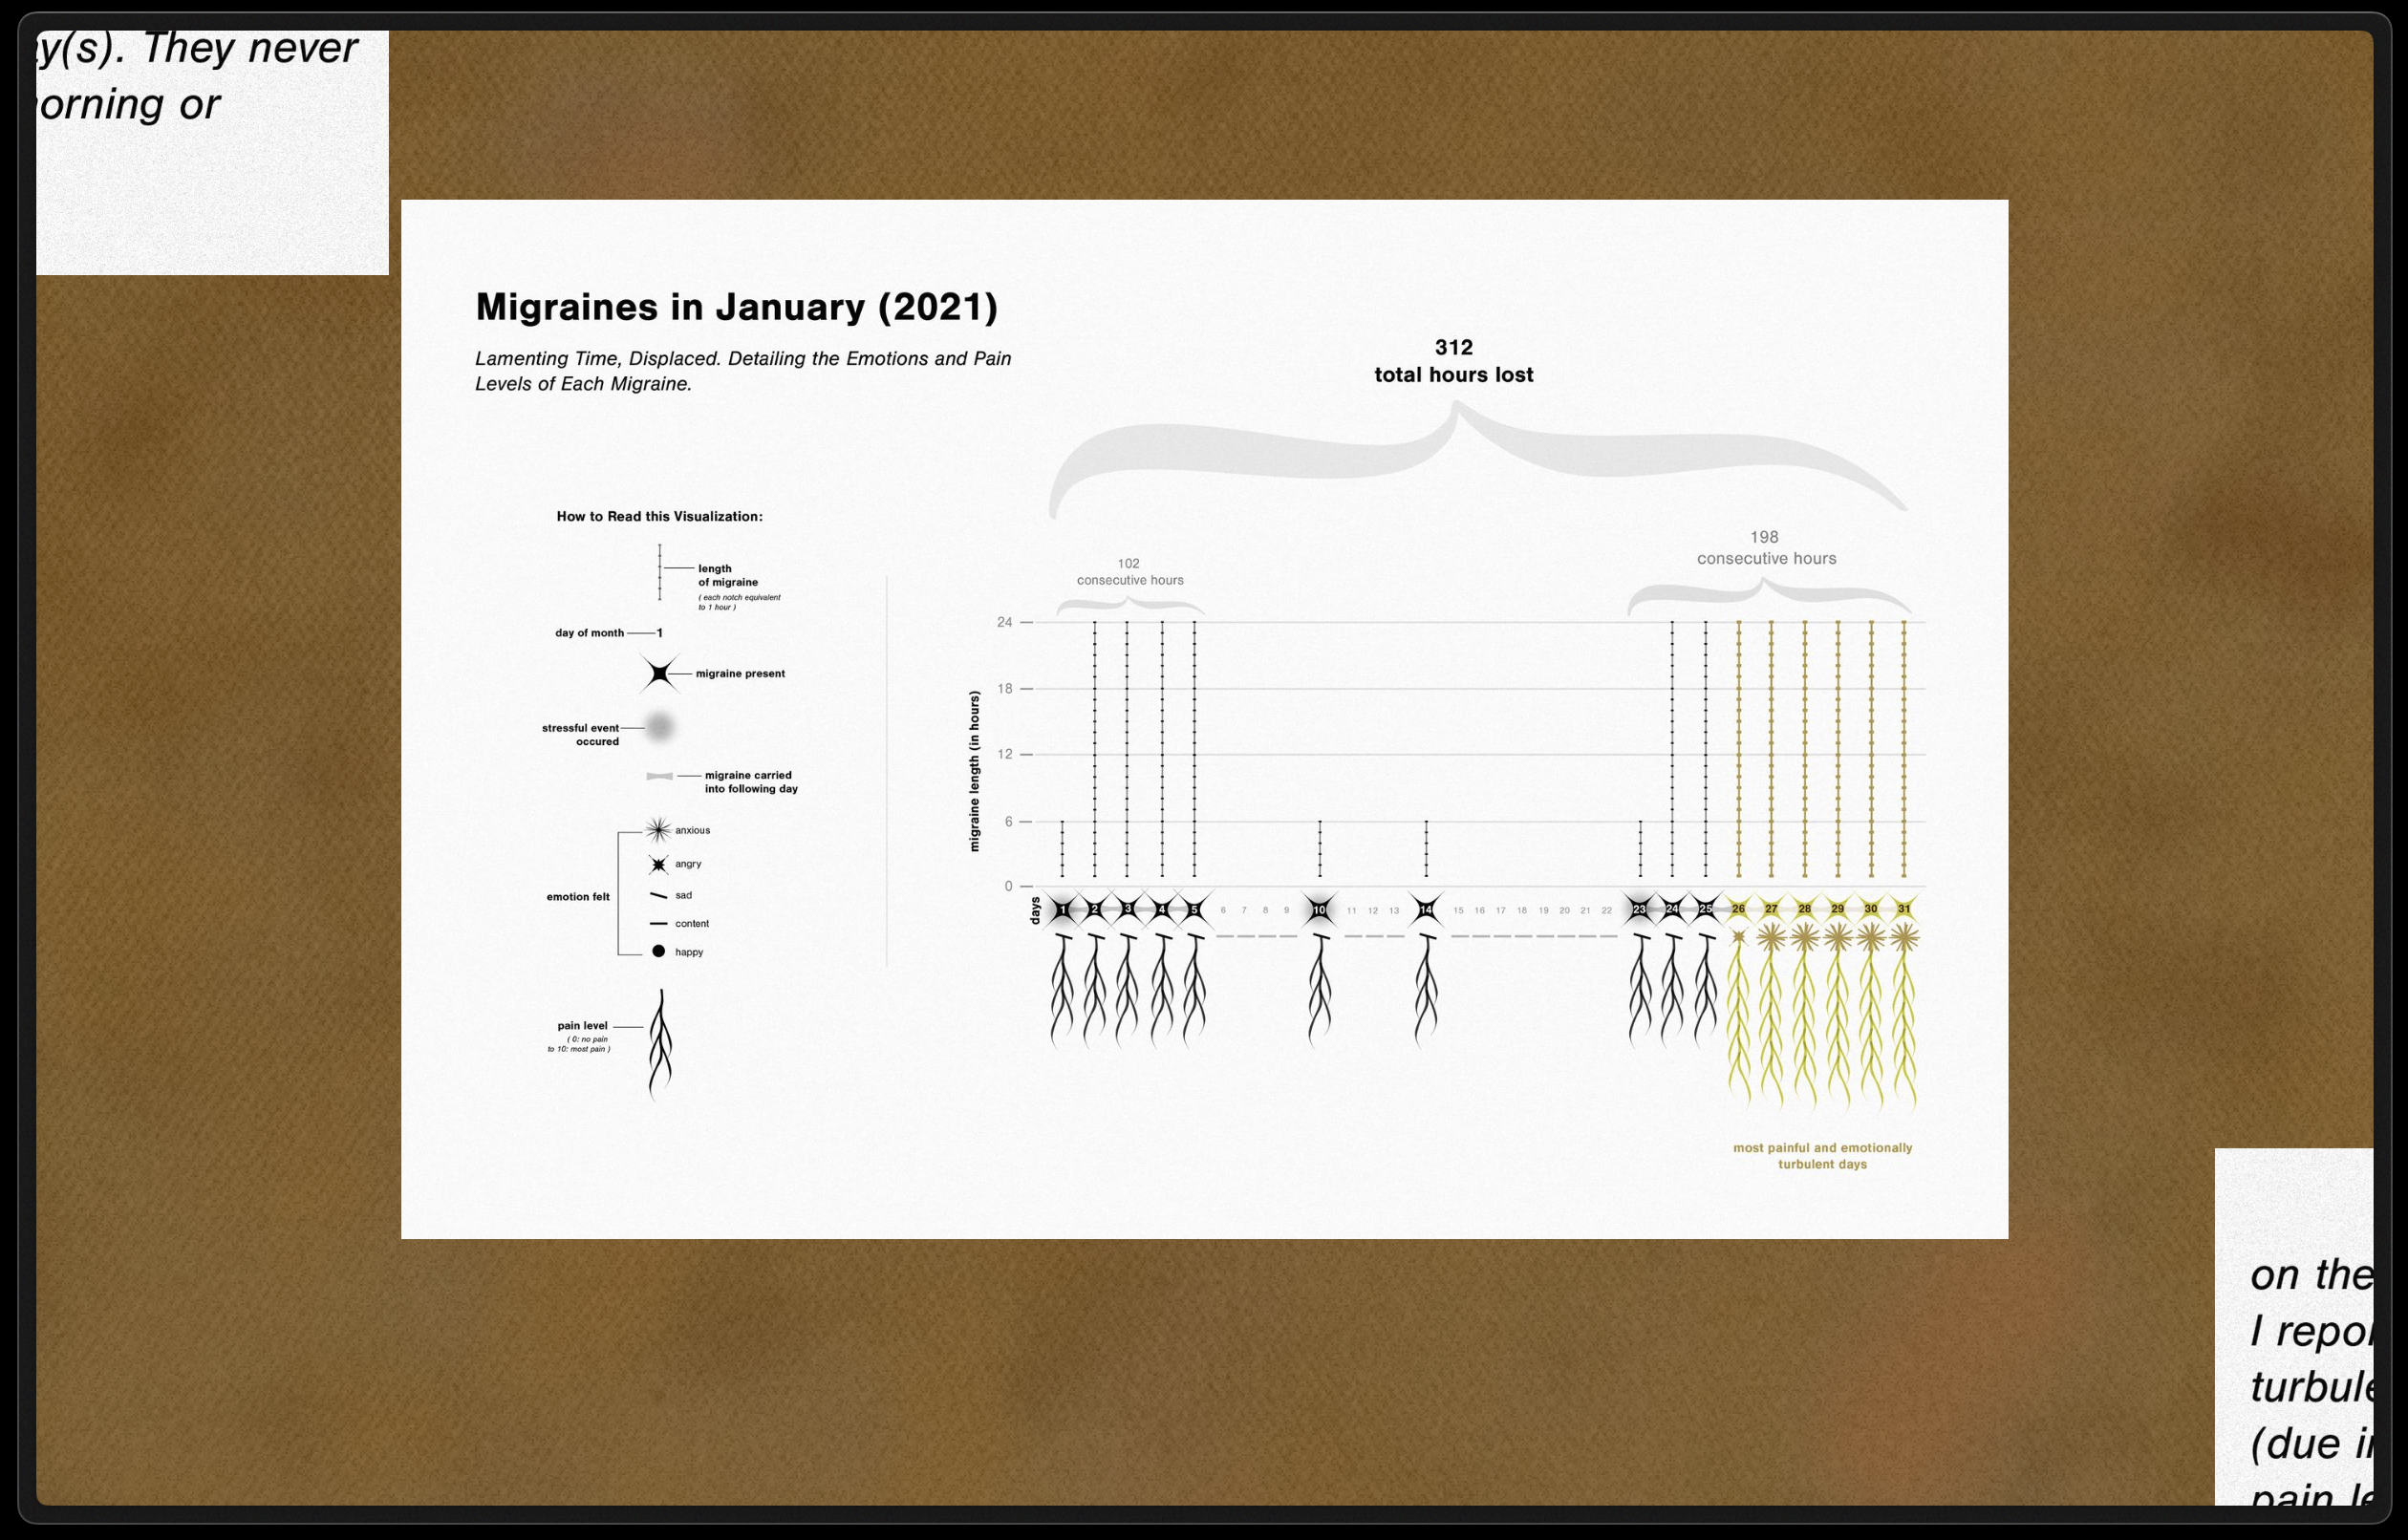
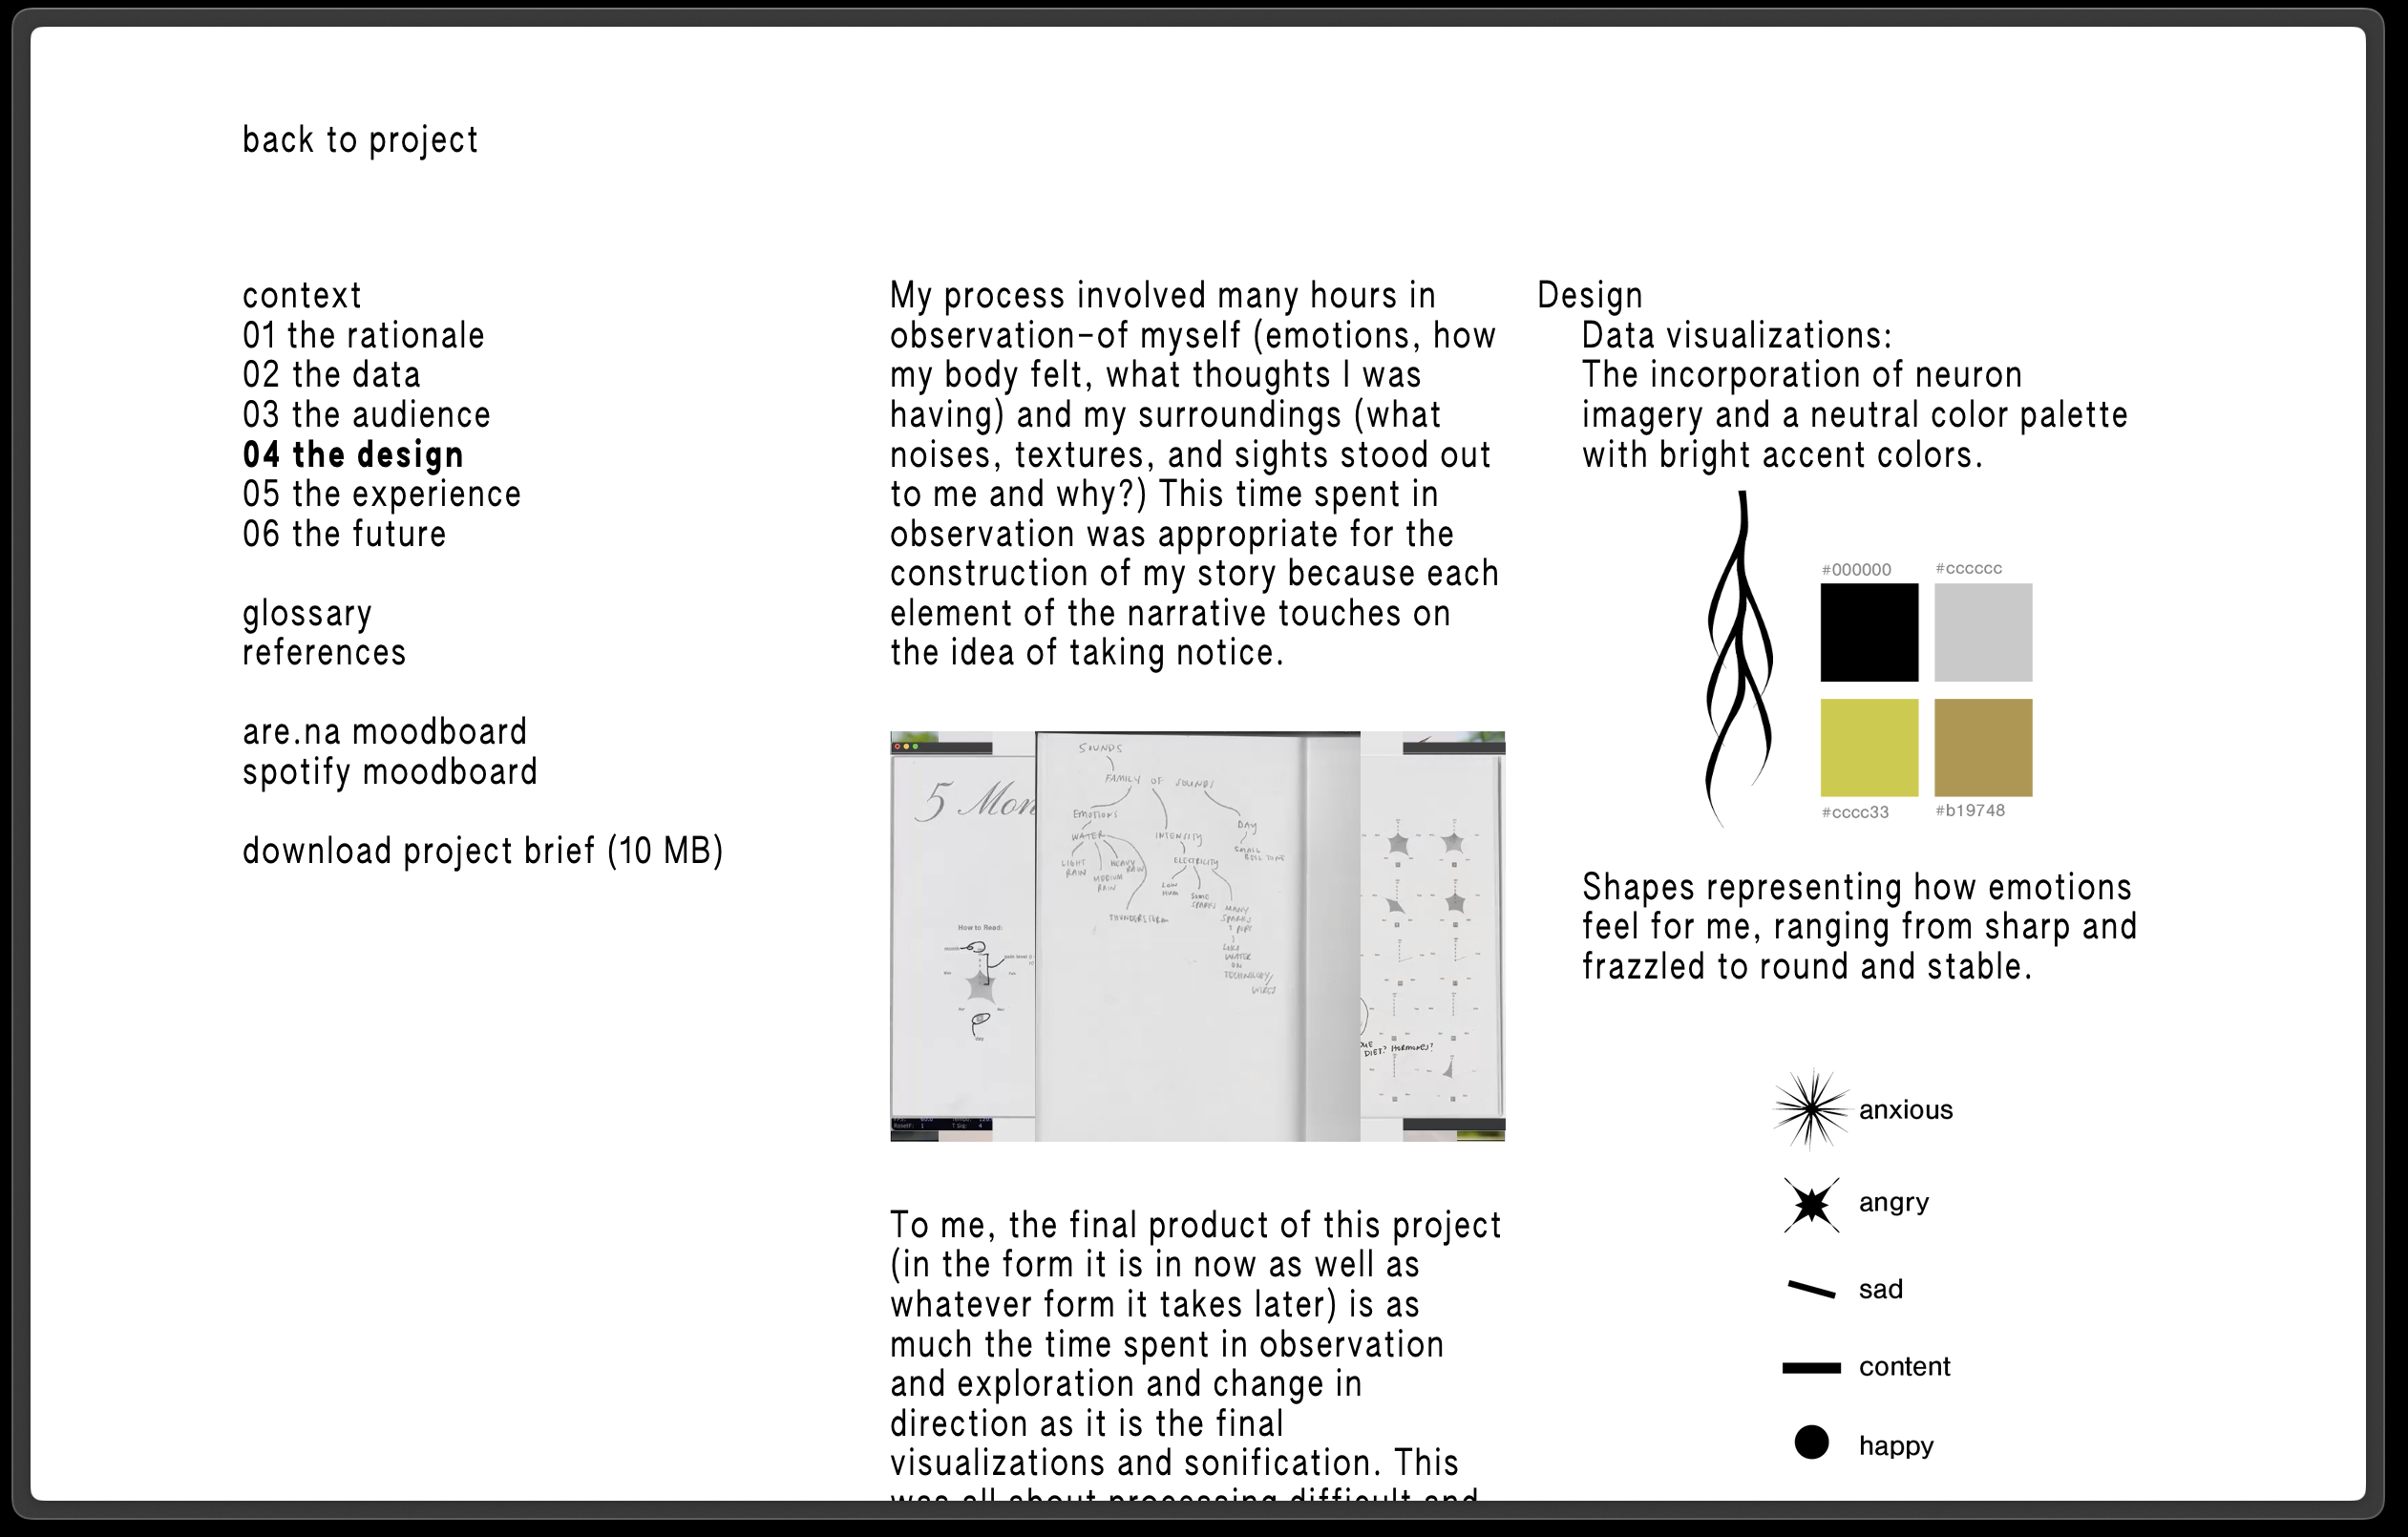
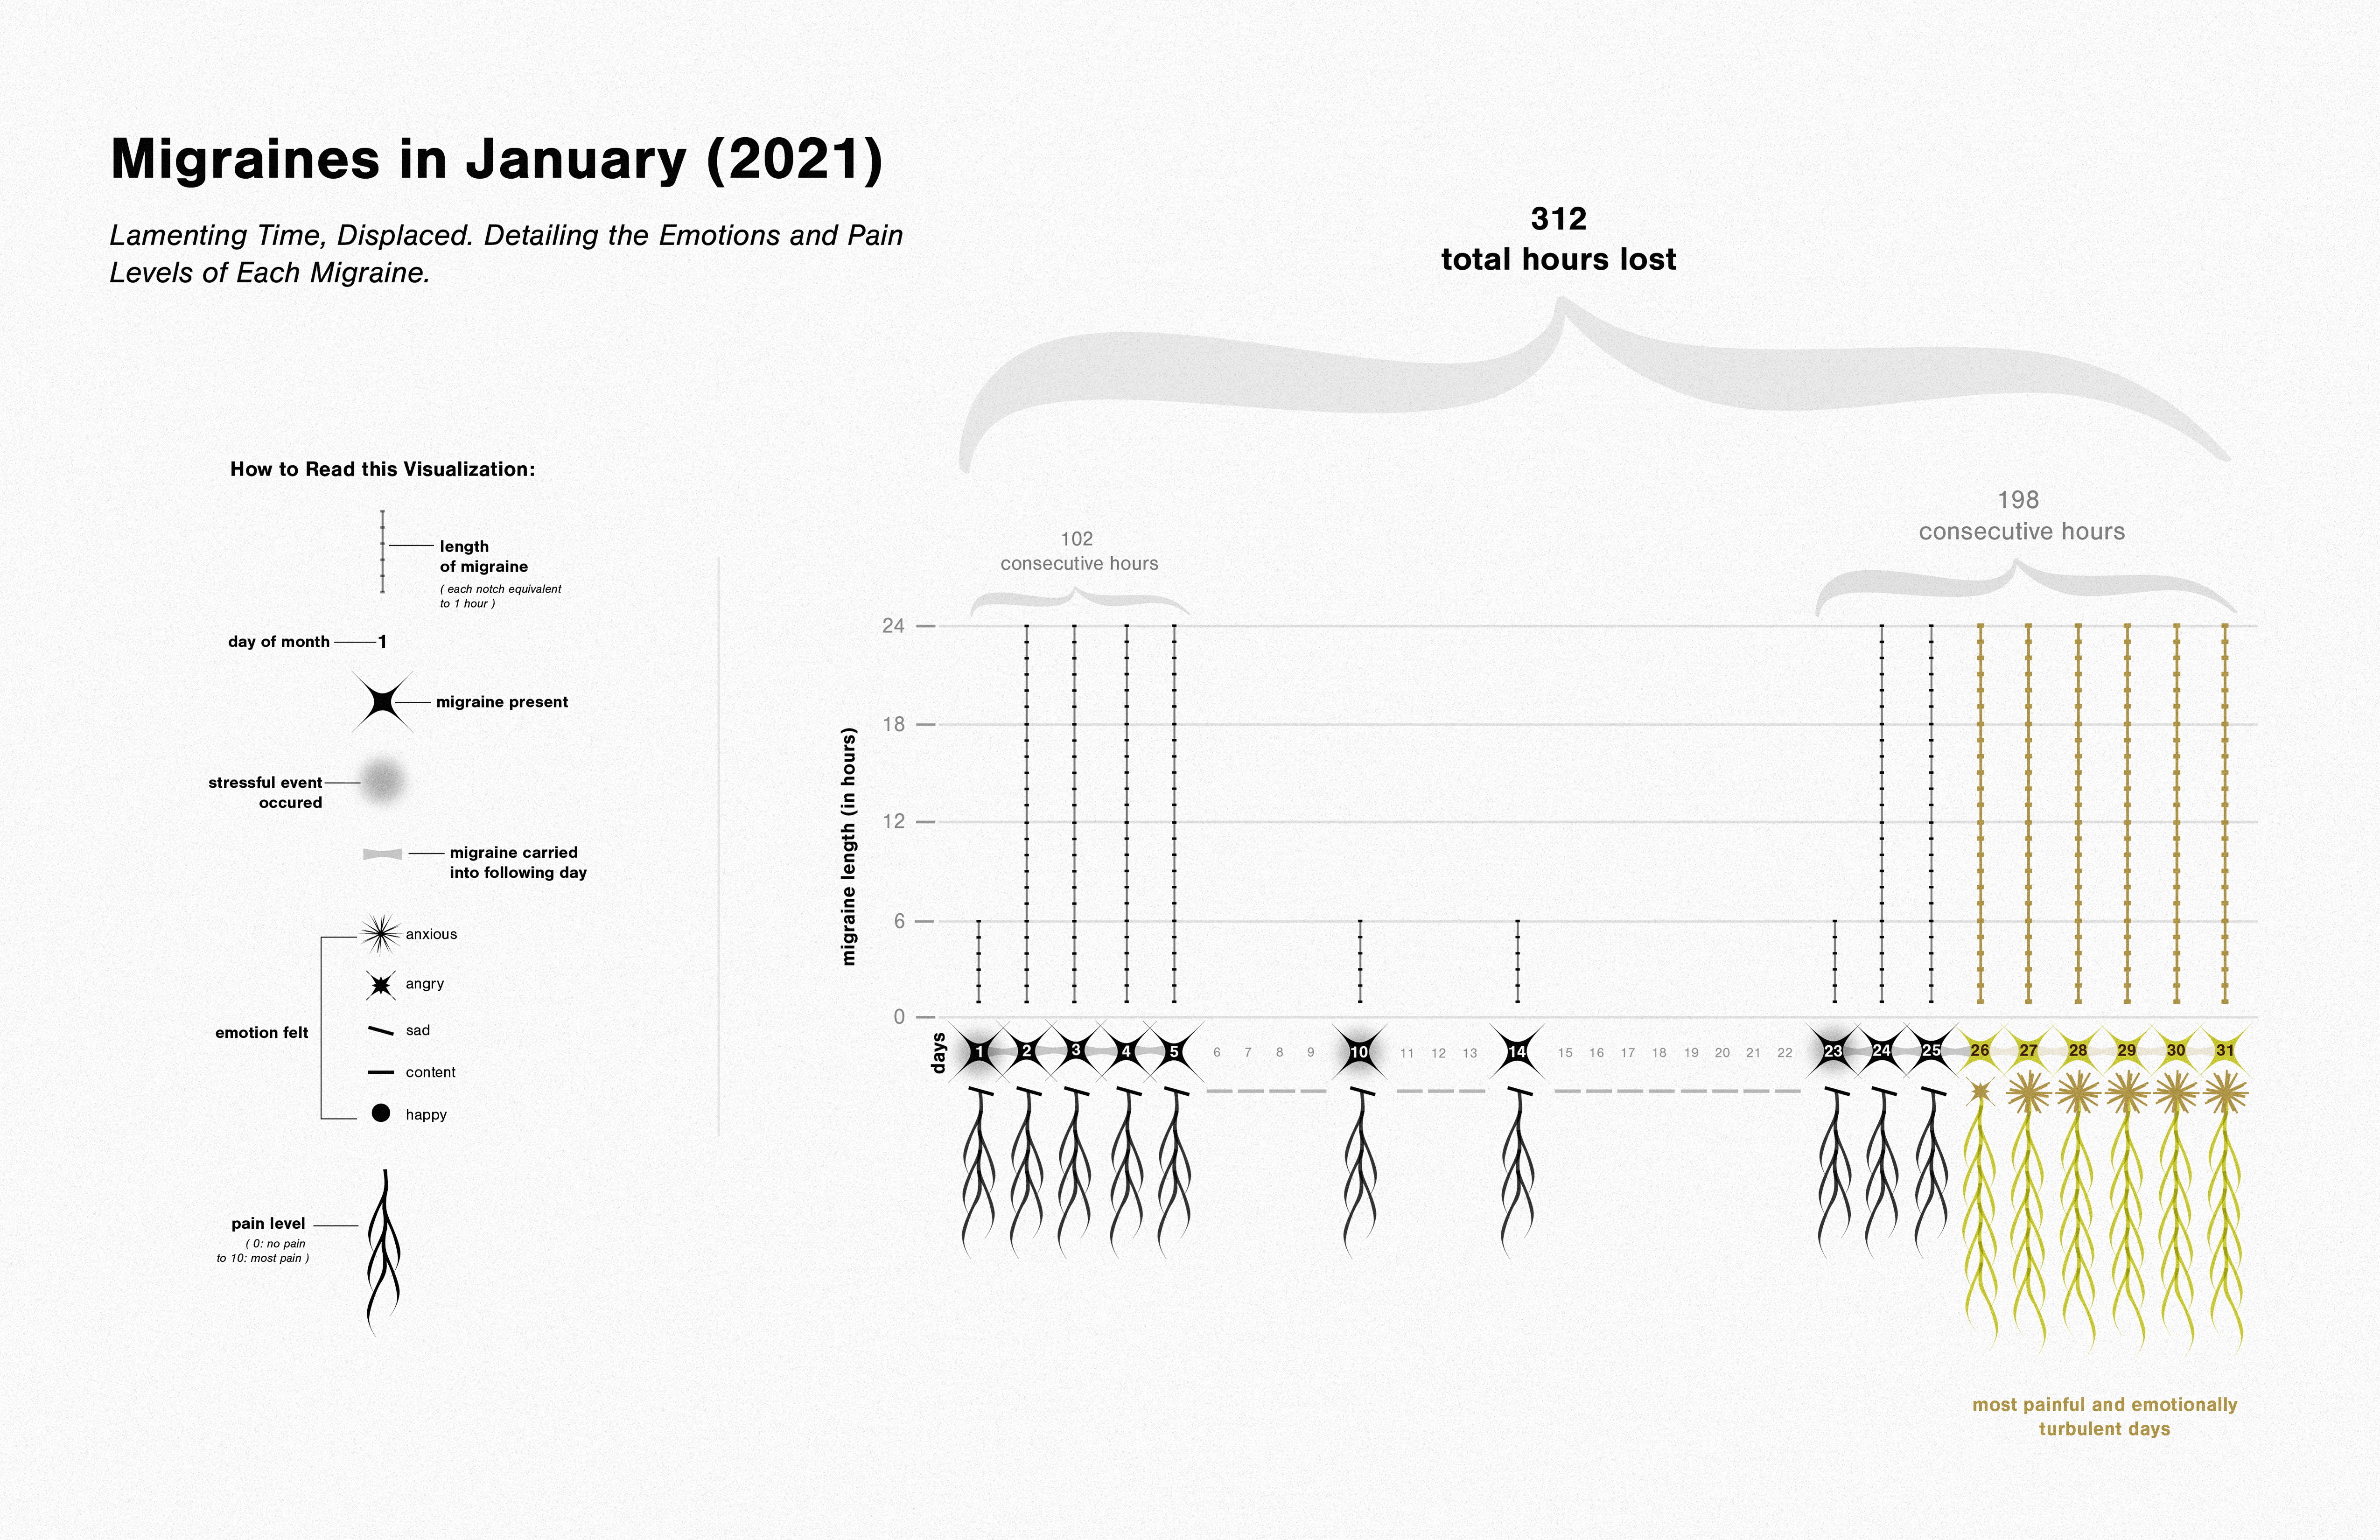
Data Vizualizations

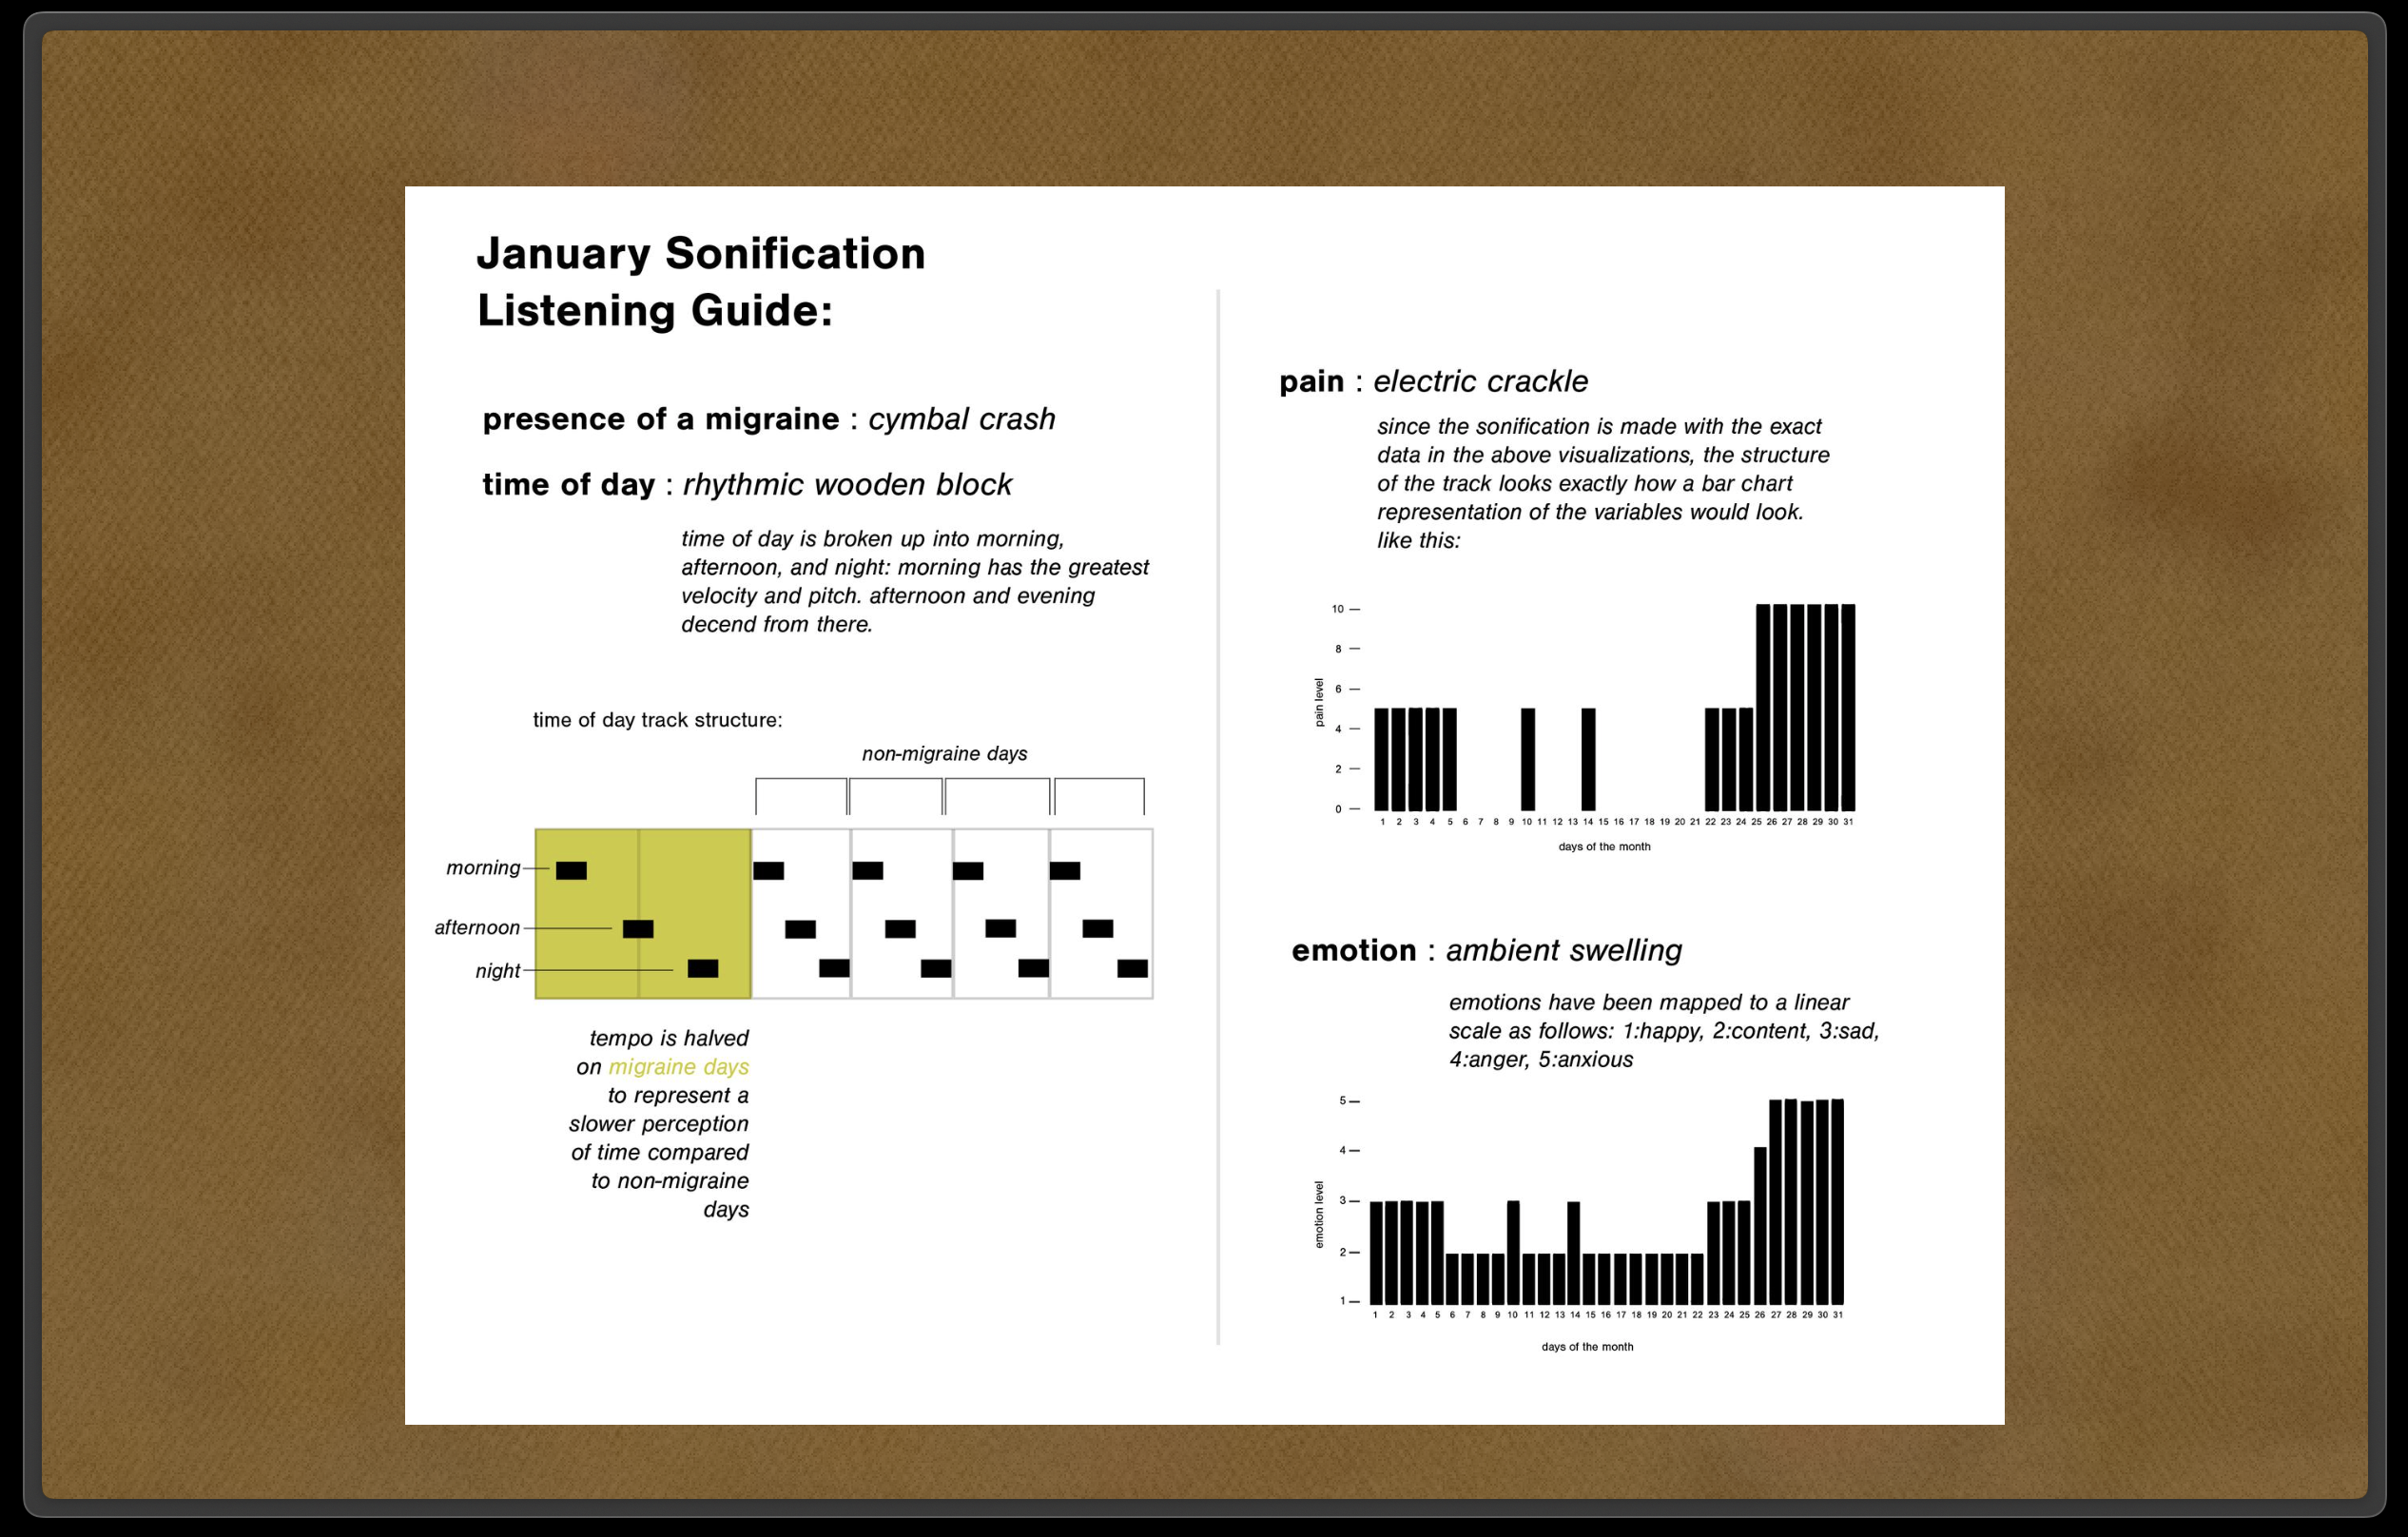
Data Sonification Listening Guide
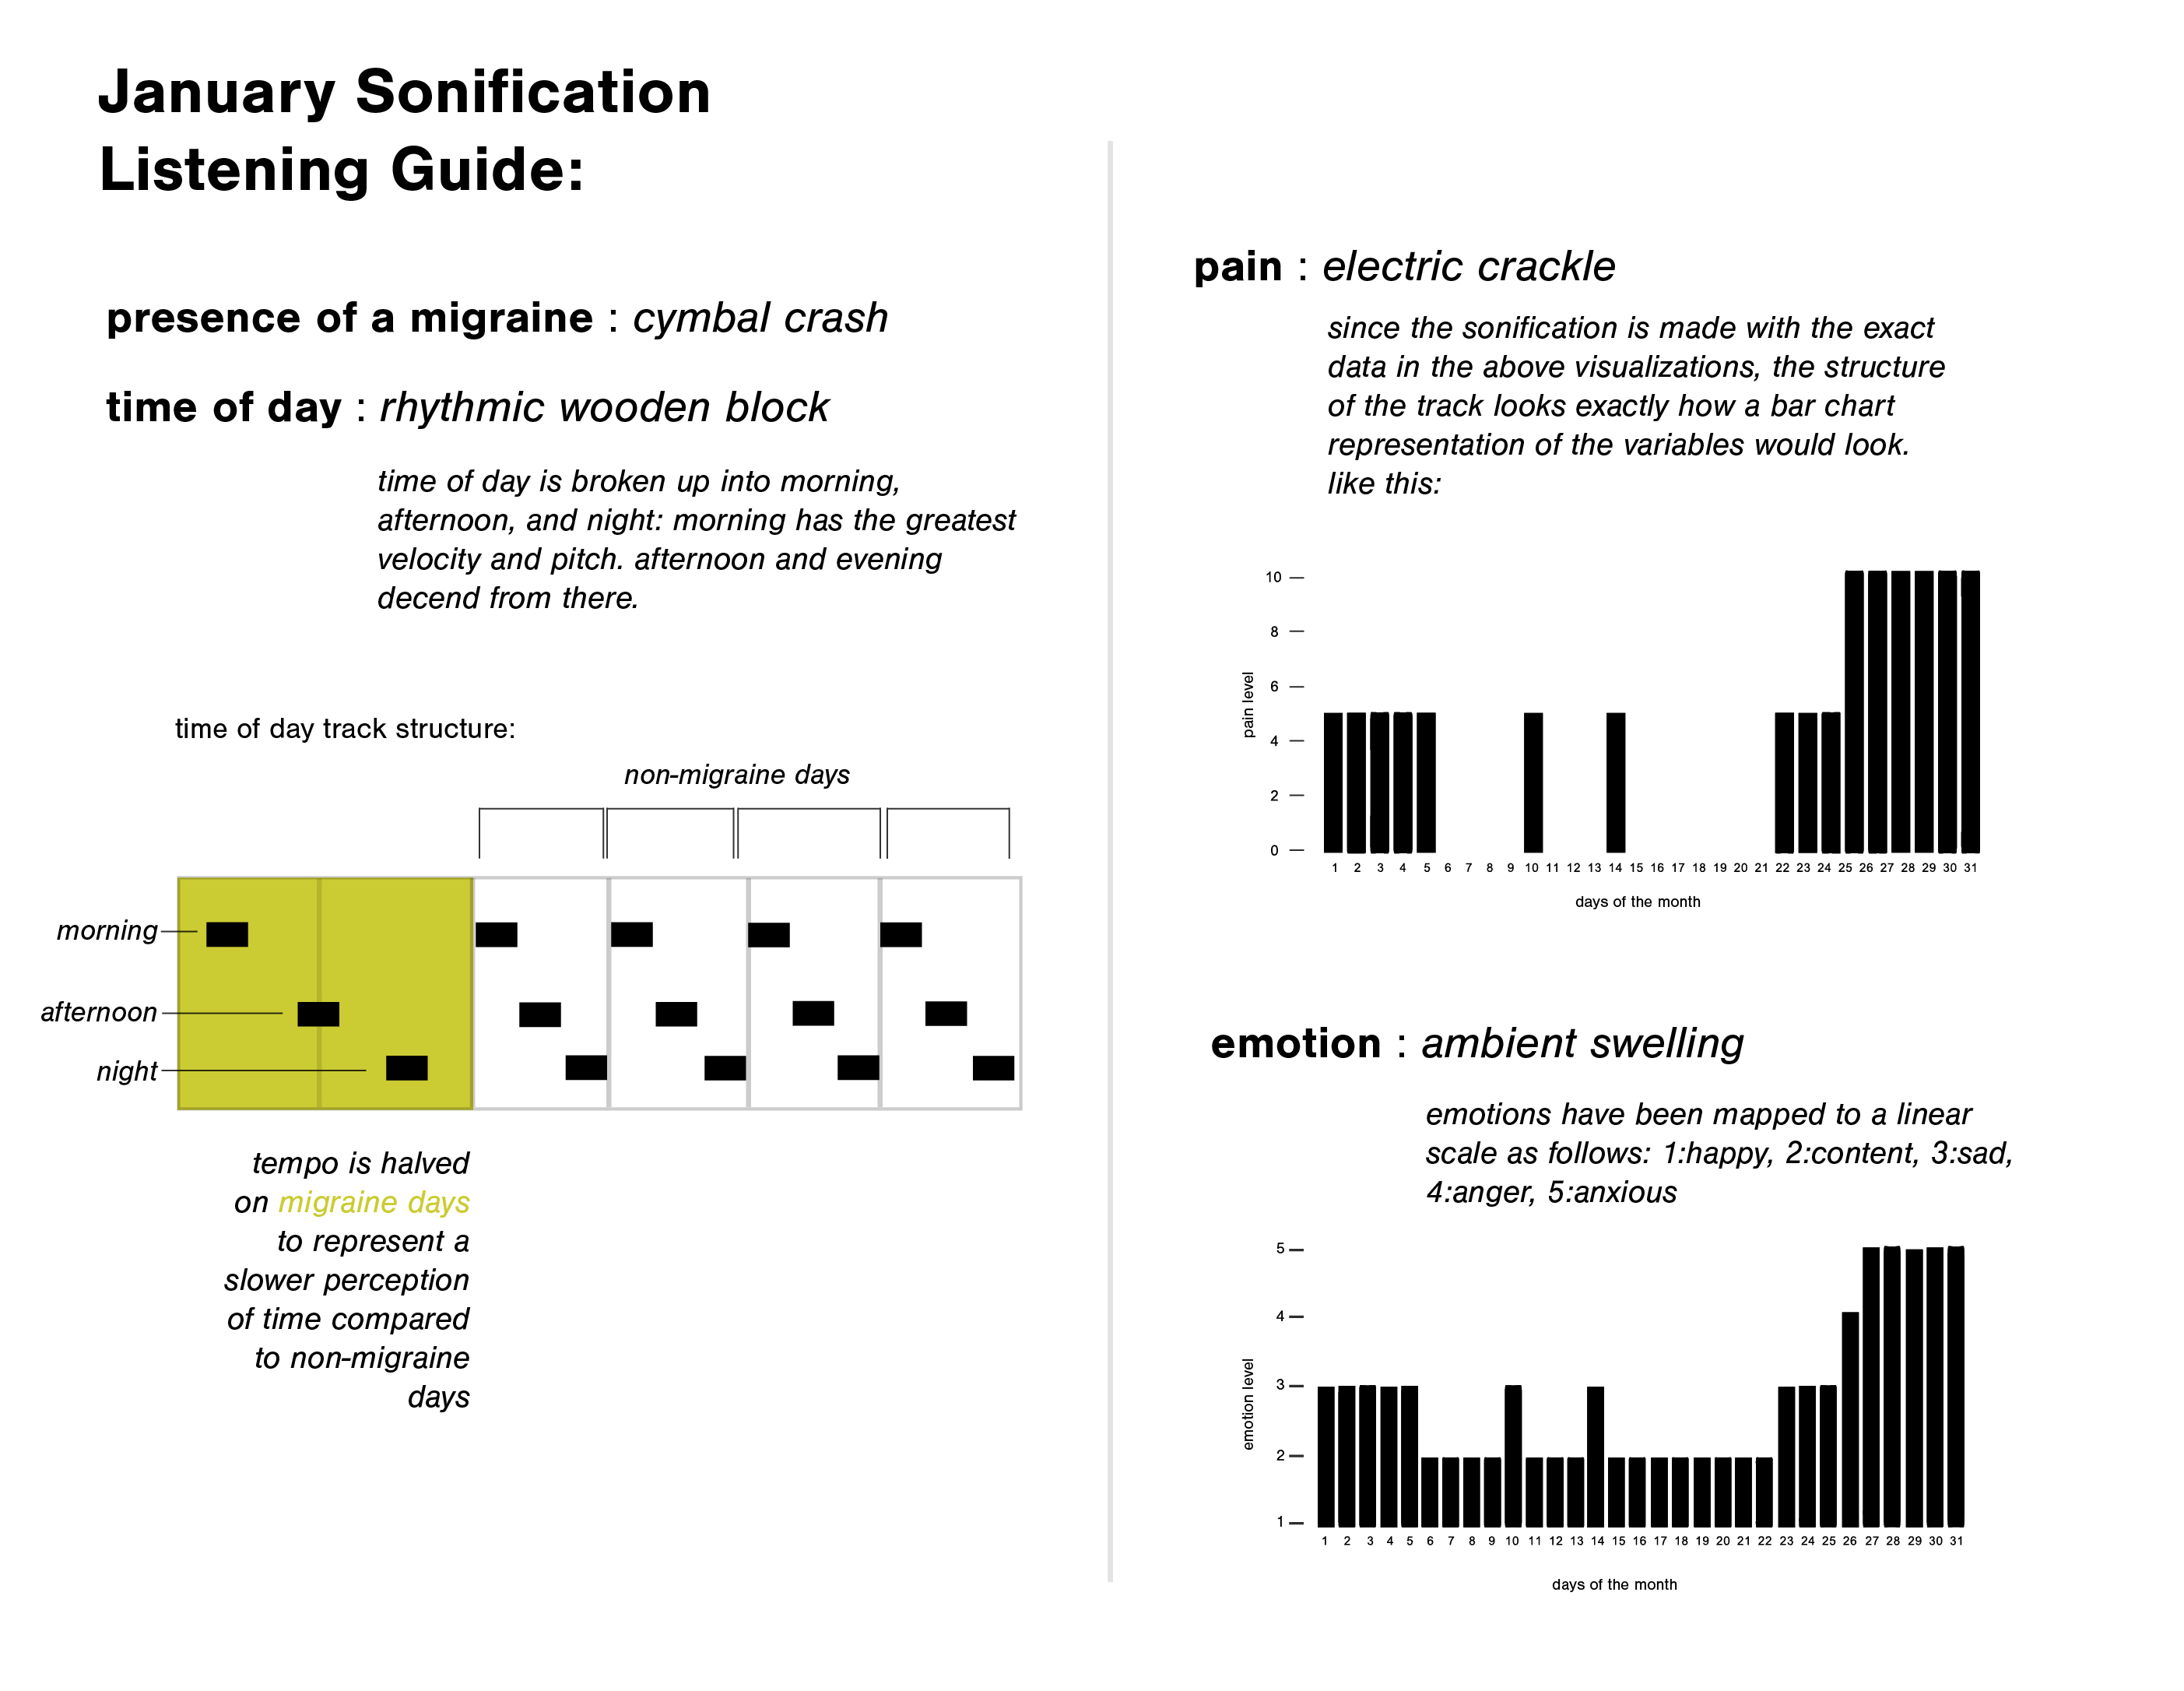
I used an application called TwoTone to create an initial sound sketch, then moved that sketch into Ableton as a base/sound foundation, where I refined and completed the data sonification.
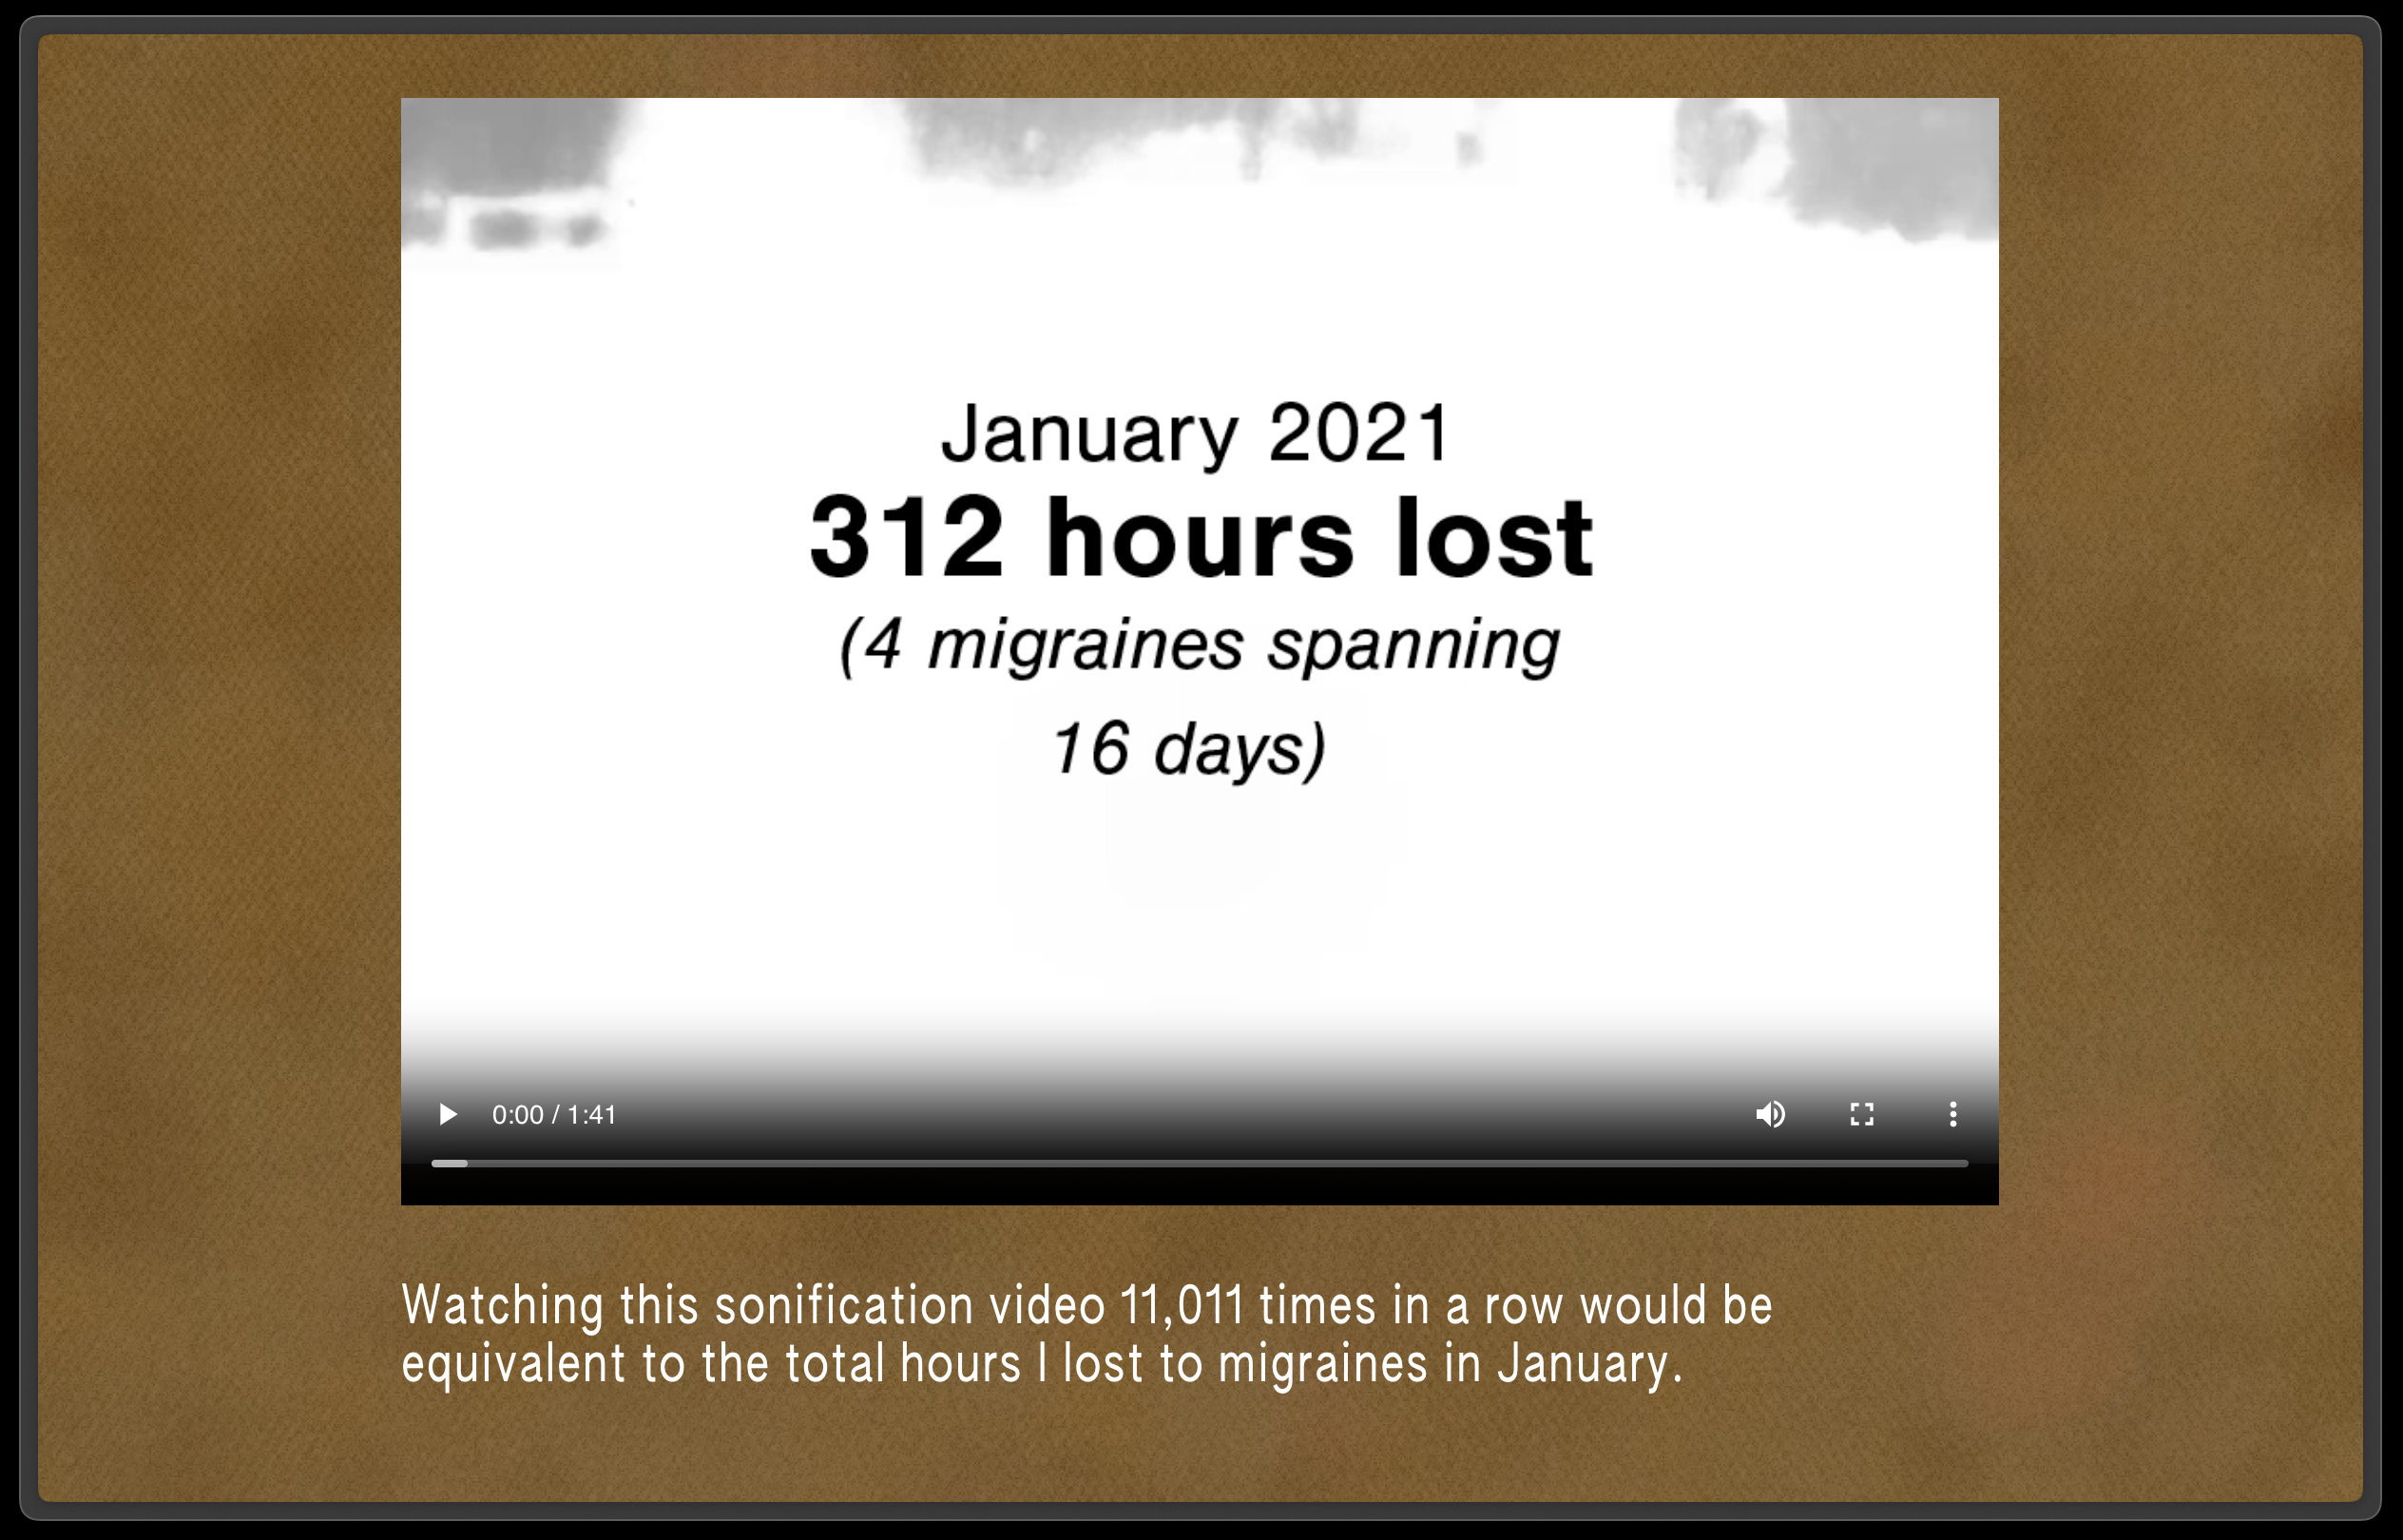
Data Sonification Video
The video footage shown includes a moving black and white scene of my view from inside a car—used to indicate absense of migraine; a bright yellow still image—indicating the presence of migraine; and a bright yellow still image with an overlayed image of a hand gripping a duvet cover in combination with the heavier auditory sounds, correlating with the days of the month that my migraines were most intense.